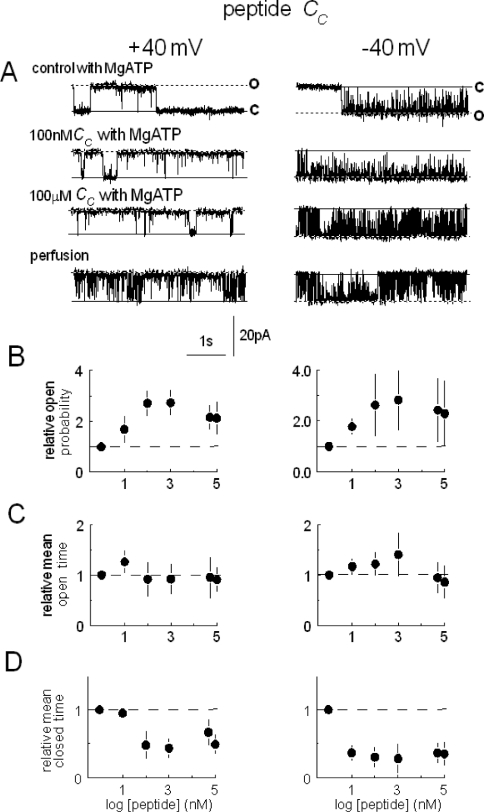
Figure 1. Peptide Cc activates RyR2 channels by abbreviating channel closures.
Channel opening (in this and subsequent Figures) is upwards at +40 mV (left-hand panels) and downwards at −40 mV (right-hand panels), from the closed level c to the maximum single channel current o. In (A), control activity is shown with 2 mM MgATP and 100 μM Ca2+ in the cis chamber (first trace), after subsequent addition of 100 nM (second trace) or 100 μM peptide (third trace), and shortly after cis perfusion with a solution containing 100 μM Ca2+ and lacking MgATP and peptide (fourth trace). Note that the peptide concentration following perfusion is approx. 30 nM and the channel remains activated. Average relative Po is shown in (B), relative Tos in (C) and relative Tcs in (D) at +40 mV (left-hand panels) and −40 mV (right-hand panels). Means are for five experiments. In (C) to (D), the first symbol and broken line shows data obtained under control conditions.

