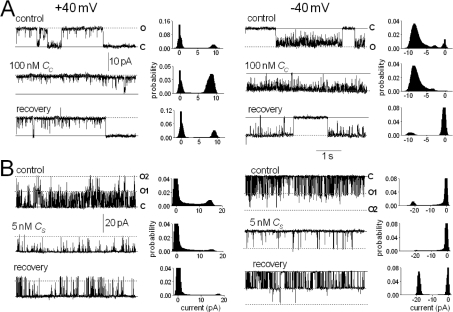
Figure 2. Reversible activation of RyR2 channels by peptide Cc and reversible inhibition by peptide Cs.
Data are shown at +40 mV (left-hand panels) and −40 mV (right-hand panels). In each panel, traces show 5 s of activity under each condition, and the associated histogram shows all-points histograms from the 30 s record. Under all conditions, 2 mM MgATP was present. The upper record shows control activity, the middle record shows activity in the presence of 100 nM peptide Cc (A) or 5 nM peptide Cs (B), and the third record shows activity between 30 and 60 s after perfusion of peptide from the cis chamber. Note that the bilayer in (B) contained two channels and that two open levels (O1 and O2) are indicated where appropriate.

