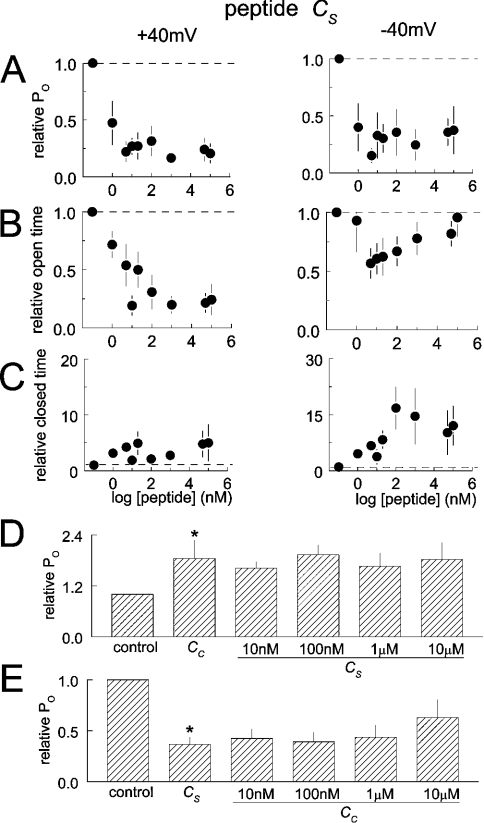
Figure 3. Changes in channel gating with peptide Cs.
(A), (B) and (C) show average relative Po (n=10), To and Tc (n=7 single-channel experiments) respectively, at +40 mV (left-hand panels) and −40 mV (right-hand panels). In (A) and (B), the first symbol and broken line show data obtained under control conditions. Note that the decline in Po is due to a fall in the duration of channel opening at +40 mV, but is due to more complex changes in the Tos and Tcs at −40 mV. (D) Average relative Po (data at +40 mV and −40 mV combined) from six experiments after exposure to 1 or 10 μM Cc, followed by exposure to 10 nM, 100 nM, 1 μM and 10 μM Cs. Note that Cs does not inhibit channels if added in the presence of Cc. (E) Average relative Po (data at +40 mV and −40 mV combined) from five experiments after exposure to 10 μM Cs, followed by exposure to 10 nM, 100 nM, 1 μM and 10 μM Cc. Note the relief of Cs inhibition at higher Cc concentrations. Asterisks indicate significant differences from the previous conditions.

