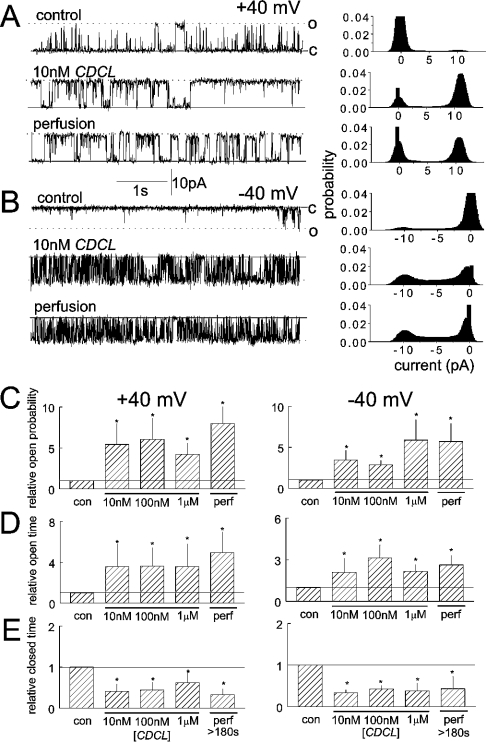
Figure 5. CDCL causes a high-affinity increase in RyR2 activity that is irreversible within the time frame of the experiment.
Brief (5 s) channel records (left-hand panels) and all-points histograms from a 30 s record (right-hand panels) are shown at +40 mV (A) and −40 mV (B). The upper record in each panel was obtained under control conditions with 10 μM cis Ca2+, the middle records in the presence of 10 nM CDCL and the final record >3 min after perfusion of CDCL from the cis chamber. The histograms in (C), (D) and (E) show average data for relative Po (C), relative To (D) and relative Tc (E) at +40 mV (left-hand panels) and −40 mV (right-hand panels). In each panel, data are shown under control conditions, with 10 nM, 100 nM and 1 μM CDCL and after perfusion of CDCL from the cis chamber. Asterisks indicate significant differences from control.

