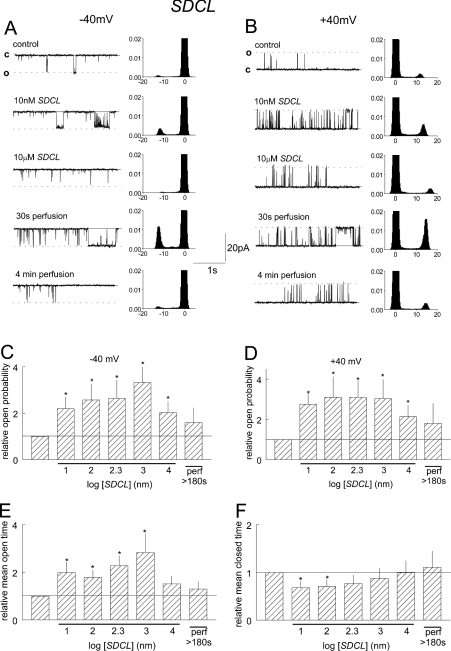
Figure 6. SDCL causes a high-affinity, slowly reversible, increase in RyR2 activity.
(A) and (B) include 5 s current recordings (left-hand panels) and all-points histograms from 30 s of channel activity (right-hand panels) at +40 and −40 mV respectively. Data are shown under control conditions with 10 μM cis Ca2+, after addition of 10 nM, then 10 μM SDCL, and then 30 s and 4 min after perfusion of SDCL from the cis chamber. (C) and (D) show relative Po at +40 mV and −40 mV. Data for average relative Tc (E) and relative Tc (F) is the combined average of values obtained at +40 mV and −40 mV, since the results were very similar at both potentials. Average values are shown under control conditions, in the presence of 10 nM, 100 nM, 200 nM, 1 μM and 10 μM SDCL, and after perfusion of 10 μM SDCL from the cis chamber. Asterisks indicate significant differences from control.

