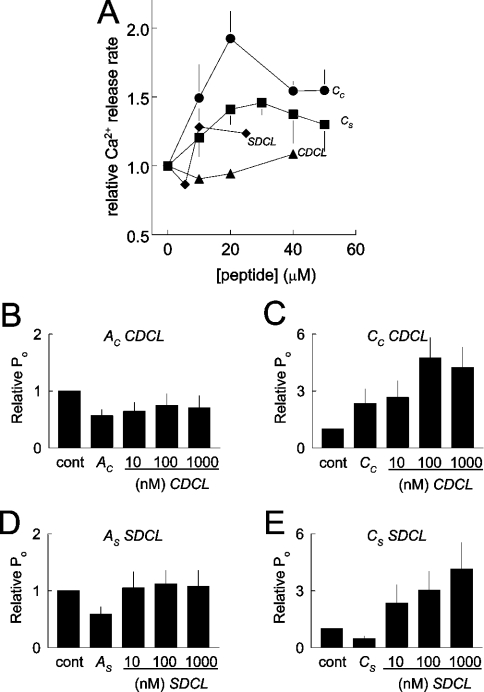
Figure 7. CDCL and SDCL increase Ca2+-induced Ca2+ release from cardiac SR vesicles and compete strongly with the A peptides and partly with C peptides when activating RyR2 channels in bilayers.
(A) Relative rates of Ca2+-induced Ca2+ release are shown as a function of peptide concentration. Average data are shown for peptide Cs (●; n=5); Cc (■; n=5); SDCL (◆; n=2) and CDCL (▲; n=2). (B)–(E) Competition between the recombinant II–III loops and A or C peptide for activation of RyR2. In each experiment, 1 μM peptide was added for 4 min, and then the channel was exposed to 10 nM, 100 nM or 1 μM of II–III loop for 4 min at each concentration. Channels were treated with Ac and CDCL (B) (n=5), Cc and CDCL (C) (n=4), As and SDCL (D) (n=4), Cs and SDCL (E) (n=4).

