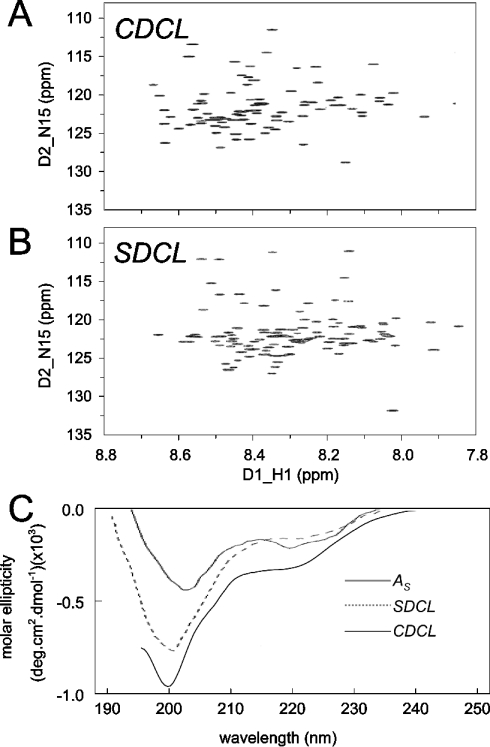
Figure 9. Comparison of the structural profiles of CDCL and SDCL.
(A) and (B) 15N/1H-HSQC spectra for CDCL and SDCL. The similar spectral distribution of cross-peaks suggest a similar degree of structure in the two recombinant proteins. (C) CD spectra for the 80% helical As peptide and for CDCL and SDCL. The spectra for the recombinant proteins show minima at approx. 200 nm, indicating less helical content than As, which has a minimum at 204 nm. The more pronounced dip at approx. 222 nm in CDCL is indicative of greater helical content in that protein.

