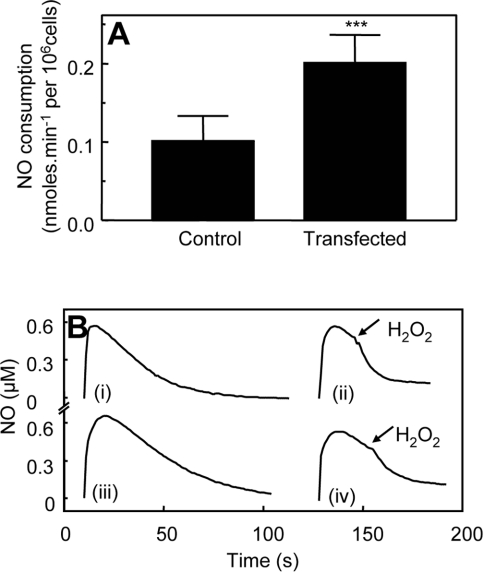
Figure 4. COS-7 cells transfected with hPGHS-2 consume NO following H2O2 addition faster than controls.
(A) NO consumption of COS-7 cells was determined as described in the Experimental section, following addition of 500 μM H2O2 to 1 ml of PBS containing 5×10⁶ cells and 1 mM CaCl2 (n≥3; means±S.D.). Bars represent rates of NO decay for cells in the presence or absence of H2O2, as appropriate. ***P<0.05 compared with control (unpaired t test). (B) Representative traces from (A): (i) NO decay in PBS containing 5×10⁶ PGHS-2-transfected COS-7 cells and 1 mM CaCl2; (ii) 500 μM H2O2 was added to PGHS-2-transfected COS-7 cells in (i); (iii) NO decay in PBS containing 5×10⁶ control COS-7 cells and 1 mM CaCl2; (iv) 500 μM H2O2 was added to control COS-7 cells in (iii).

