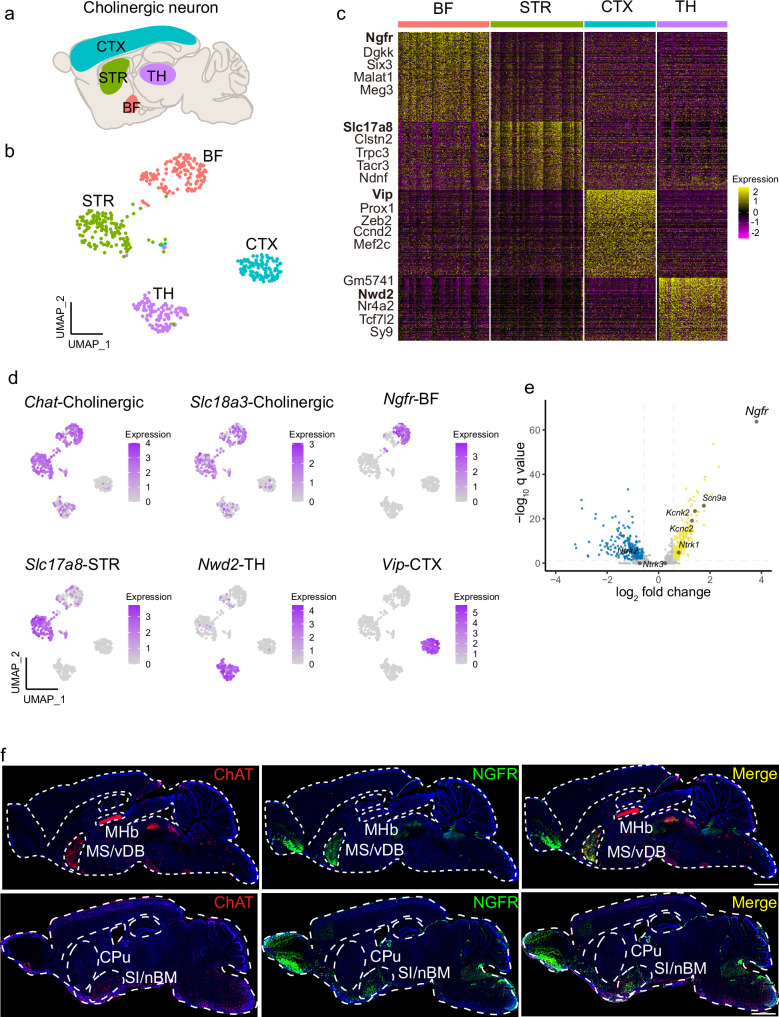
Fig. 1. Ngfr specifies cholinergic projection neurons in BF.
a Schematic illustration of the cholinergic neurons that dispersed in the basal forebrain (BF), striatum (STR), cortex (CTX), and thalamus (TH). b Visualization of cholinergic neuron clusters from different anatomic boundaries using UMAP (single-cell RNA sequencing data from the DropViz dataset). Numbers of Chat+ cholinergic neuron sampled in each region are indicated. BF, n = 142 cells; STR, n = 144 cells; CTX, n = 111 cells; TH, n = 109 cells. c Hierarchical clustering of the expression profile of cholinergic neurons from different regions. Top five differentially expressed genes (DEGs) in each cholinergic cluster are indicated. d Visualization of each cholinergic cluster using specific marker genes in UMAP. Cholinergic, Chat and Slc18a3; basal forebrain, Ngfr; striatum, Slc17a8; thalamus, Nwd2; cortex, Vip. e Volcano plot showing the DEGs that differentiate the BF cholinergic projection neurons from the other cholinergic clusters. Top DEGs are highlighted (log2 fold change > 1, q < 0.05). log2 fold change > 1 indicates genes enriched in the BF cholinergic neurons. f Spatial distribution of ChAT and NGFR expression. Sagittal brain section of wild-type mice at the age of 3 months is subjected to immunofluorescence staining. NGFR co-localized with ChAT+ cholinergic neurons in the MS/vDB (top row) and SI/nBM (bottom row), but not with the cholinergic neurons in the MHb (top row) and CPu (bottom row). MHb medial habenular nucleus, CPu caudate putamen. Scale bar, 1 mm. Statistical analyses in (c) and (e) were performed by two-sided Wilcoxon rank-sum test, p value adjusted by false discovery rate (FDR) to get the q value.

