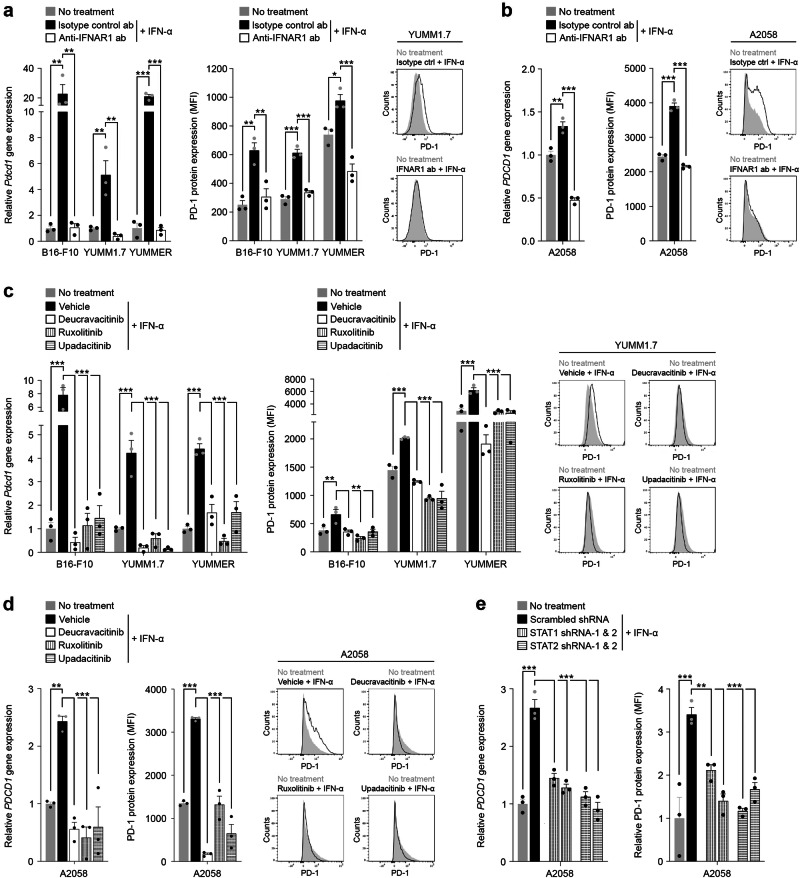
Fig. 4. Inhibition of the type I Interferon signaling axis reverses melanoma cell-PD-1 induction.
Relative PD-1 gene (fold change, mean ± SEM, left) and PD-1 surface protein (fluorescence intensity, mean ± SEM, right) expression by IFN-α stimulated a, murine and b, human melanoma cells pre-treated with either blocking anti-IFNAR1 (white bars) or isotype control ab (black bars), compared to no IFN-α treatment controls (gray bars), as determined by RT-qPCR and flow cytometry, respectively. Representative flow cytometric histograms for a YUMM1.7 and b A2058 cells are shown (right). Relative PD-1 gene (fold change, mean ± SEM, left) and PD-1 surface protein (fluorescence intensity, mean ± SEM, right) expression by IFN-α (white bars) versus vehicle control (black bars) treated c murine and d human melanoma cells pre-incubated with FDA-approved small molecule inhibitors targeting the type I interferon pathway mediators, TYK2 (deucravacitinib) or JAK1 (ruxolitinib or upadacitinib), compared to no IFN-α treatment controls (gray bars), as determined by RT-qPCR and flow cytometry, respectively. Representative flow cytometric histograms for c YUMM1.7 and d A2058 cells are shown (right). e, Relative PDCD1 gene (fold change, mean ± SEM, left) and PD-1 surface protein (fluorescence intensity, mean ± SEM, right) expression by IFN-α treated STAT1 or STAT2 knockdown (shRNA-1/-2, white patterned bars) versus scrambled control shRNA (black bars) melanoma A2058 cells, compared to no IFN-α treatment controls (gray bars), as determined by RT-qPCR and flow cytometry, respectively. Results in a–e represent biologically independent experiments of n = 3. Statistical analyses in a–e included the one-way ANOVA with Dunnett post hoc test. *p < 0.05; **p < 0.01; ***p < 0.001. See also Supplementary Fig. 10. Source data, including exact p-values, are provided as a Source Data file.

