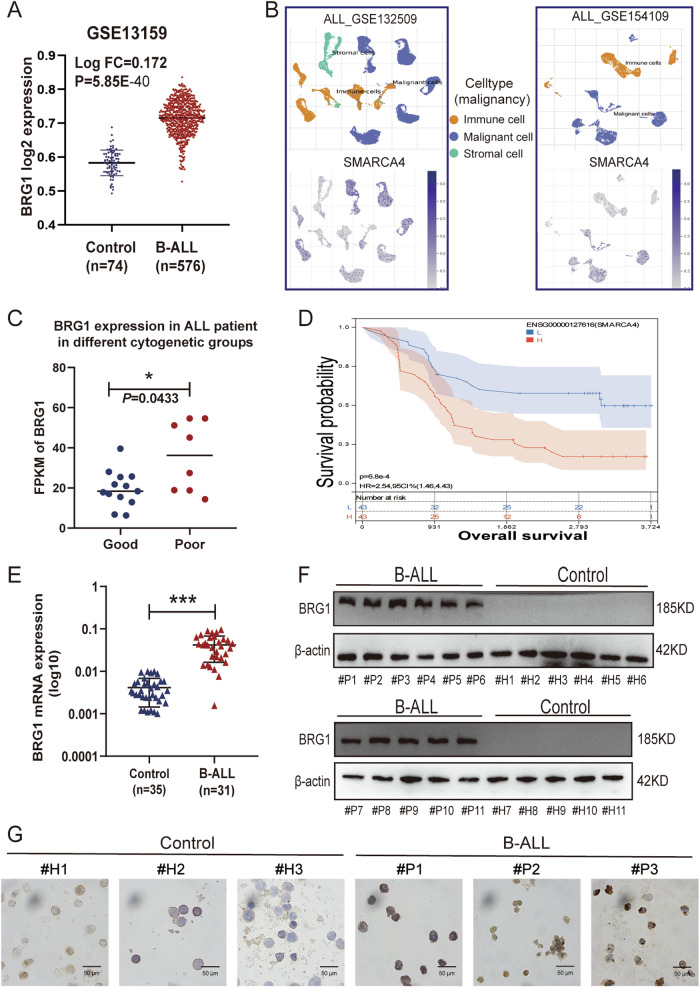
Fig. 1. BRG1 is overexpressed in B-ALL patients and is associated with worse outcomes.
A mRNA expression of SMARCA4 in the GSE13159 dataset (B-ALL, n = 576; Control, n = 74). Comparative analysis of single-cell sequencing data from the GSE132509 and GSE154109 datasets, with orange representing immune cells, blue representing malignant cells, and green representing stromal cells. B Images of BRG1 expression level analysis in immune cells, malignant cells and mesenchymal cells. National Comprehensive Cancer Network (NCCN) Guidelines version 1.2023-defined risk groups were used to divide tumour samples in the TCGA dataset for SMARCA4 gene expression (logPRKM). C Scatter-bar plot of mRNA expression of BRG1 in TCGA adult B-ALL dataset aged >18 years (6570 days). D Kaplan–Meier survival curve in TARGET dataset. E The mRNA expression of BRG1 was analysed via qRT-PCR in healthy control (n = 35) and patients with B-ALL (n = 31). F The expression of BRG1 was detected by immunoblotting in healthy control (#H1-#H11) and patients with B-ALL (#P1-#P11). G Representative images of ICC staining of BRG1 in B-ALL samples (#P1-#P3) and healthy control samples (#H1-#H3) (scale bar = 50 μm). (*P < 0.05; ***P < 0.001).

