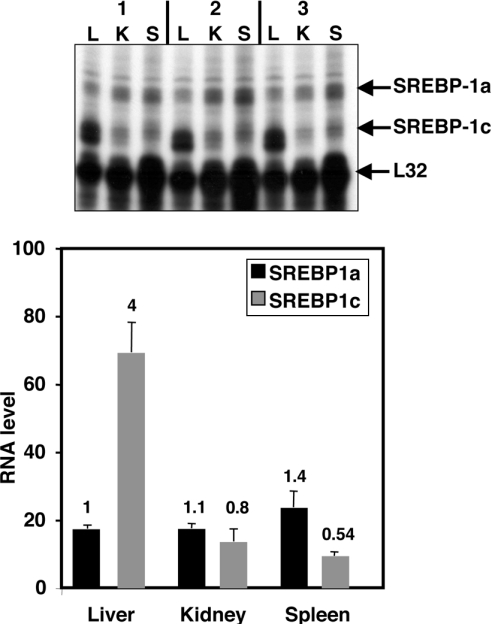
Figure 1. mRNA levels for SREBP-1a and SREBP-1c in select tissues.
Total RNA was isolated from different tissues (L, liver; K, kidney; S, spleen) from three different mice (labelled 1–3) fed with a normal diet. Levels of SREBP-1a or -1c-specific mRNAs and the control ribosomal protein L32 mRNA were measured using an RPA as described in the Materials and methods section. The autoradiogram is shown in the upper panel. Different exposures of the gel were scanned and band intensities were measured for samples from all animals for each mRNA and values were normalized to the L32 signal. The ratio of the signal for 1a or 1c relative to L32 is plotted on the y-axis in the lower panel. The value for SREBP-1a in liver was set at 1 and the number on the top of each bar represents the value relative to this level.

