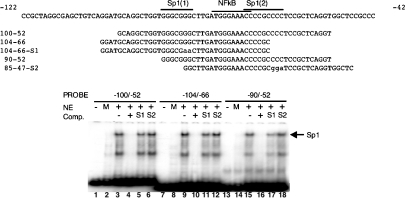
Figure 6. Binding of Sp1 to the SREBP-1a promoter analysed by EMSA.
The DNA sequence for the proximal region of the mouse SREBP-1a promoter, along with locations of the putative Sp1 and NF-κB sites, is shown in the upper panel. The sequences for individual probes derived from this sequence and used in the EMSA studies are shown below the wild-type sequence. Mutations generated in probes S1 and S2 are noted in lower-case. An autoradiogram from a typical EMSA is shown in the lower panel. The identity of the three probes that were 32P-labelled and used in the EMSA are shown. ‘NE’ denotes nuclear extract prepared from mock-transfected SL2 cells (M) or from SL2 cells transfected with the pPACSp1 expression vector (+). Where indicated, a 50-fold molar excess of the indicated unlabelled double-stranded oligonucleotide (‘Comp.’) was included in the binding reactions with the labelled probes. (+) denotes that the cold competitor was the same DNA used as a probe. S1 and S2 denote the use of mutant probes containing the mutations shown in the top of the Figure.

