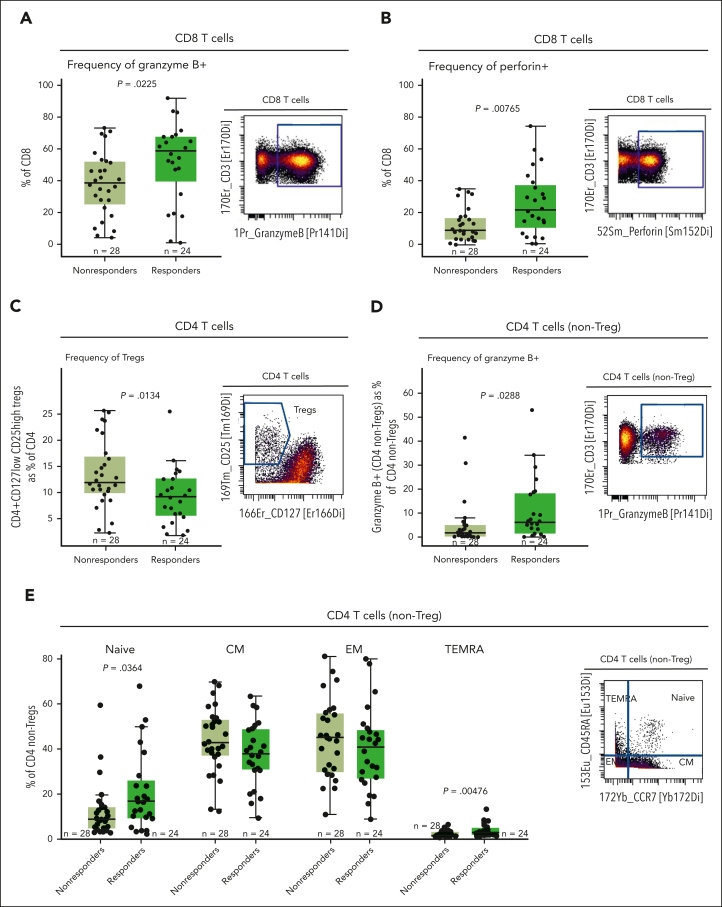
Figure 2.
Higher proportions of granzyme B–producing and perforin-producing CD8 T cells, granzyme B–expressing CD4 non-Tregs, and naive CD4 T cells, as well as lower Treg proportion in the BM microenvironment at baseline were associated with lower response rates to teclistamab. (A) Frequency of CD8 T cells expressing granzyme B in a subset of 52 patients at the RP2D doses assessed at baseline by CyTOF. (B) Proportion of CD8 T cells expressing perforin relative to response assessed by CyTOF. (C) Percentage of CD4+CD27lowCD25hi Tregs in the BM microenvironment relative to response assessed at baseline by CyTOF. (D) Frequency of granzyme B–positive CD4 T cells (non-Tregs) assessed at baseline by CyTOF. (E) Proportion of the memory subset in the BM microenvironment at baseline assessed by CyTOF. Representative staining is shown on the right of each panel. Statistical significance was calculated using the Wilcoxon rank-sum test. CM, central memory; EM, effector memory; TEMRA, terminally differentiated effector memory cells re-expressing CD45RA.

