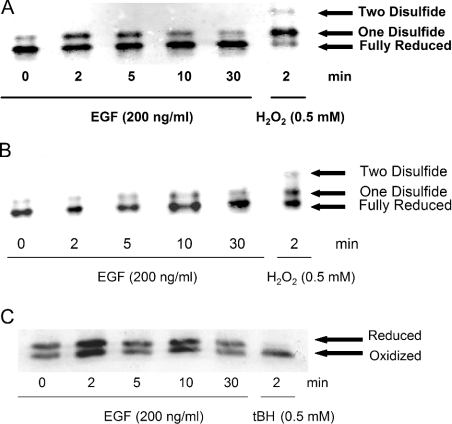
Figure 2. Redox states of cytoplasmic and nuclear Trx1 and Trx2 pools.
(A, B) Time course of Trx1 oxidation in the cytoplasm (A) and the nucleus (B) following EGF (200 ng/ml) treatment from 0–30 min. Trx1 appears as three distinct bands. The two-disulphide form (top band) is only visible under highly oxidizing conditions. The oxidized band (middle) represents the one-disulphide form and the lower band is the fully reduced form. H2O2 was used as a positive control. (C) Time course of Trx2 redox state following EGF (200 ng/ml) treatment from 0–30 min. Separation of reduced and oxidized bands is based on a mass shift due to AMS alkylation of thiols. tBH (t-butyl hydroperoxide) was used as a positive control.

