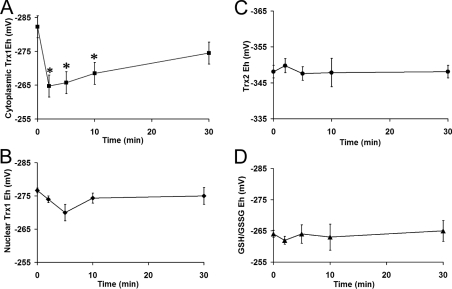
Figure 3. EGF signalling differentially affects redox pools.
Changes in Eh values of (A) cytoplasmic Trx1, (B) nuclear Trx1, (C) Trx2 and (D) GSH in EGF-treated HaCaT cells over 30 min. Values were calculated using the Nernst equation (see the Experimental section). Results are means±S.E.M for at least three separate experiments. Asterisks (*) denote a statistically significant difference (P<0.05) as compared with the control

