FIGURE 2.

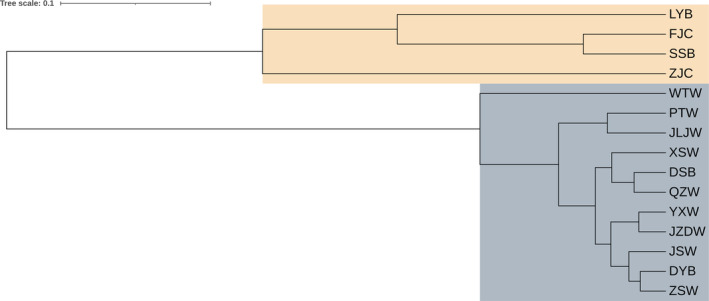
Neighbor‐joining tree of mtDNA (COI + cyt b) sequences in the large yellow croaker. Yellow color indicates the cultured populations, SSB and LYB are clustered together, gray color indicates the 11 wild populations are clustered together.

Neighbor‐joining tree of mtDNA (COI + cyt b) sequences in the large yellow croaker. Yellow color indicates the cultured populations, SSB and LYB are clustered together, gray color indicates the 11 wild populations are clustered together.