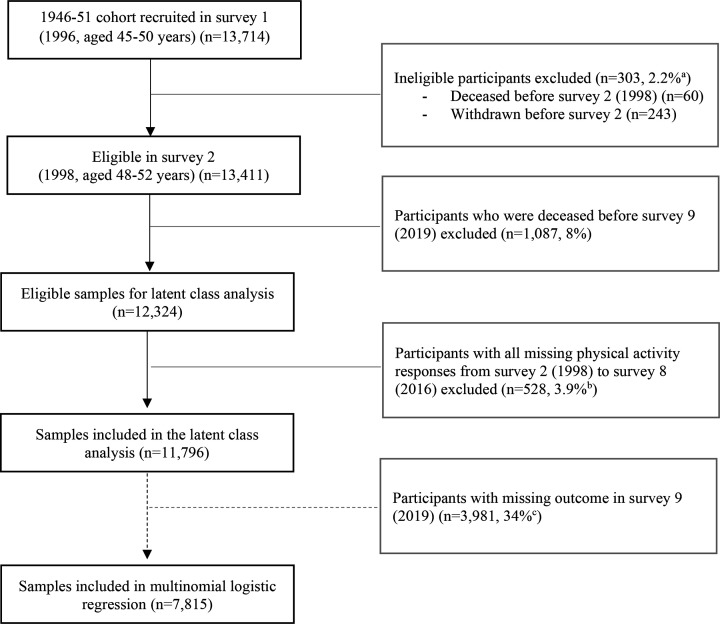
Figure 1.
Sample selection flow chart of the 1946–1951 born women in the Australian Longitudinal Study of Women’s Health.aThe percentage was calculated based on the number of participants who were recruited in survey 1 (n=13,714). bThe percentage was calculated based on the number of participants who were recruited in survey 2 (n=13,411). cThe percentage was calculated based on the number of participants included in the latent class analysis (n=11,796).

