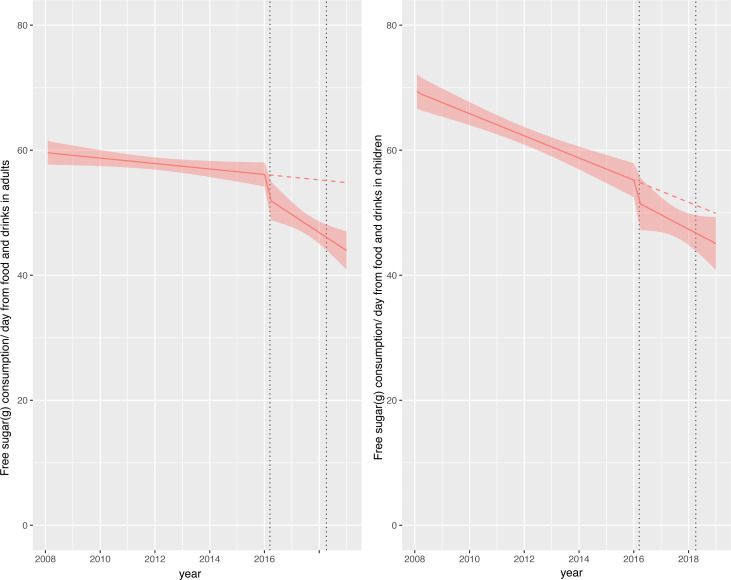
Figure 2.
Observed and modelled daily consumption (g) of free sugar from food and drink products per adult/child from April 2008 to March 2019. Red points show observed data and solid red lines (with light red shadows) show modelled data (and 95% CIs) of free sugar consumed from food and drinks. The dashed red line indicates the counterfactual line based on pre-announcement trends and if the announcement and implementation had not happened. Modelled protein consumption from food and drinks (control group) was removed from the graph to include resolution but is available in the supplementary section. The first and second dashed lines indicate the announcement and implementation of the soft drinks industry levy (SDIL), respectively.

