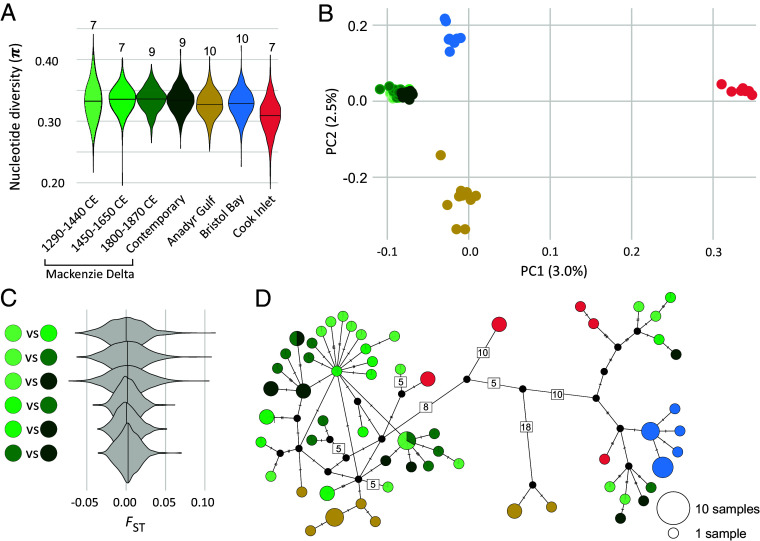
Fig. 3.
Genomic analysis of belugas sampled across four time periods from the Mackenzie Delta, and three adjacent populations. (A) Genome-wide nucleotide diversity for each group, with sample sizes indicated. (B) Principal component analysis, indicating the percentage of variation described by each axis. (C) Fixation index FST of all pairwise comparisons of the four Mackenzie Delta time-periods. (D) Network of the 60 mitochondrial haplotypes found among 77 beluga individuals. Relative circle size indicates the number of individuals sharing a haplotype. The number of substitutions among haplotypes are indicated by hashes or by numbers for >4. Of note, length of branches between haplotypes is not drawn to scale.

