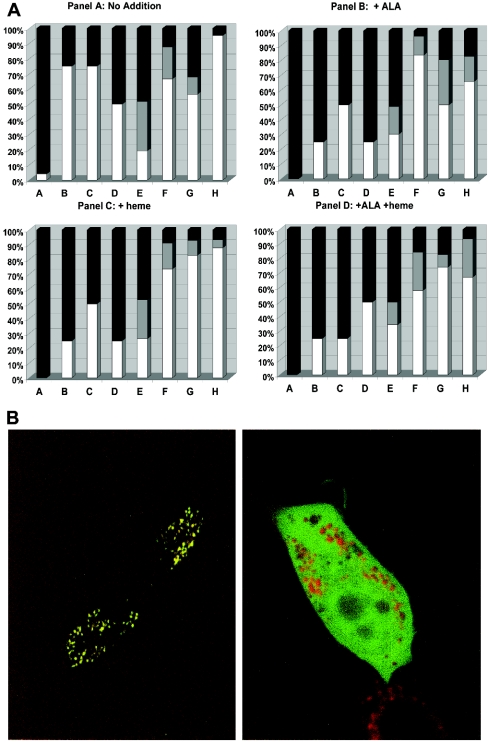
Figure 1. Fusion translocation to mitochondria.
(A) Bar graph of ALAS-GFP fusion constructs showing targeting to mitochondria. Cells in which the GFP fluorescence was located in the mitochondria are shown in white; cells in which fluorescence was located in both the mitochondria and the cytoplasm are shown in grey; cells in which fluorescence was located in the cytoplasm are shown in black. Panel A shows the results for cultures incubated with no ALA or haemin addition. Panel B shows the results for cultures incubated with 400 μM ALA. Panel C shows the results for cultures incubated with 100 μM haemin. Panel D shows the results for cultures incubated with both 400 μM ALA and 100 μM haemin. All culture additions were made 4 h before examination. For each construct, at least 50 GFP-positive cells were scored for the presence or absence of GFP targeting to the mitochondria. (B) Representative pictures showing (i) GFP fluorescence targeted to the mitochondria as determined by co-localization with the mitochondria-specific dye Mitotracker Red and (ii) GFP fluorescence diffused throughout the cell in contrast with the mitochondrial localization of the Mitotracker Red fluorescence. These images were obtained for targeted and non-targeted ALAS, but are characteristic of all other targeted and non-targeted proteins examined in this study.

