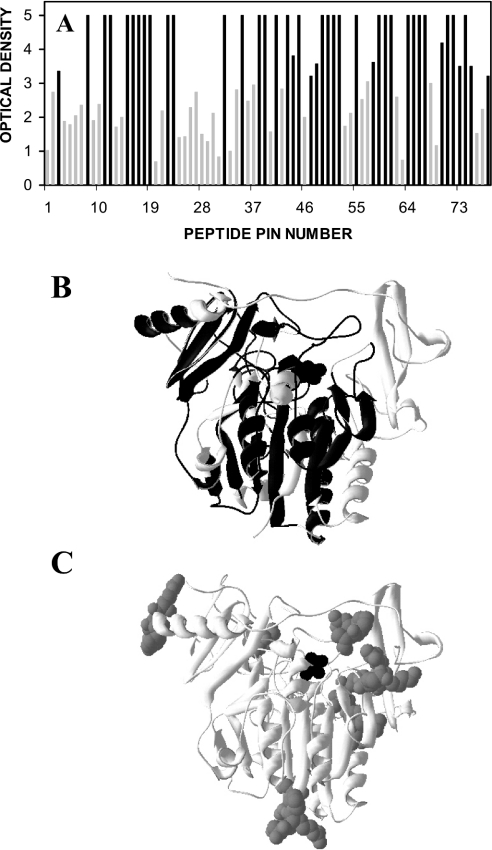
Figure 1. Epitope reactivity of IDS polyclonal antibody.
(A) Epitope reactivity of a sheep polyclonal antibody raised against IDS, expressed as individual peptide sequences across the IDS protein. The level of ELISA reactivity to each peptide sequence was expressed in terms of A410 (‘optical density’). Black bars denote high-affinity epitope reactivity. (B) Epitopes detected by the sheep anti-IDS polyclonal antibody (black) mapped on to a structural representation of IDS. (C) The N-linked carbohydrate structures (grey spheres) depicted on the same structural representation of IDS (black spheres show the active site). N-linked glycosylation sites were located on the peptides of pins 4–5, 16–17, 20–21, 35–36, 40, 46–47, 73–74 and 77.

