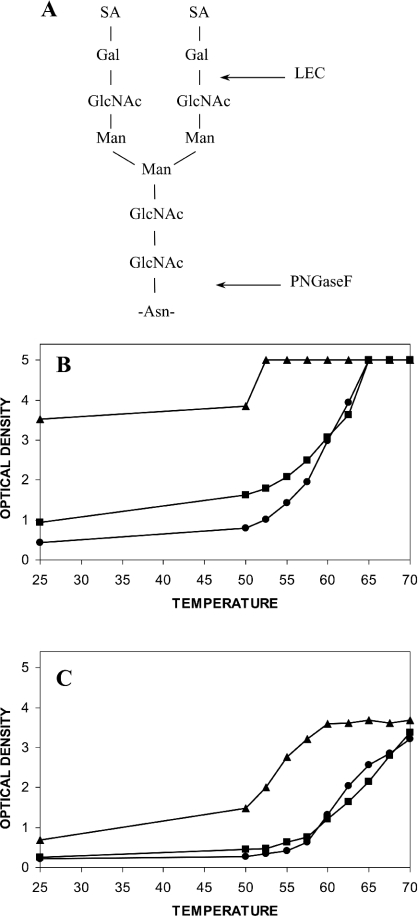
Figure 4. Structure of a typical complex N-linked oligosaccharide and thermal denaturation profiles for CHO, LEC and PNGaseF-treated CHO IDS.
(A) The positions of the LEC and PNGaseF digest sites are marked. (B) The thermal denaturation profile for CHO (●), LEC (■) and PNGaseF-treated CHO (▲) IDS detected by the monoclonal antibody 2G3.2B9. (C) The thermal denaturation profile for CHO (●), LEC (■) and PNGaseF-treated CHO (▲) IDS detected by the monoclonal antibody 7B9.1B10. Results represent the level of ELISA reactivity at each temperature and were expressed in terms of A410. All samples were assayed in triplicate and the result presented as the mean (S.D. for all sample points was less than 0.2).

