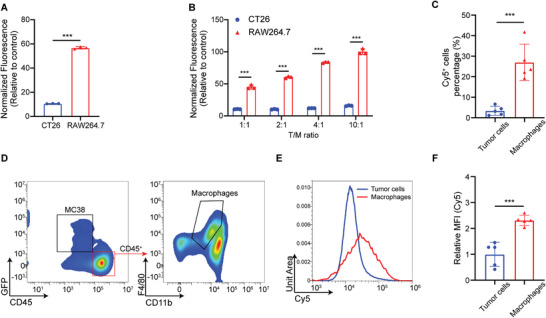
Figure 2.

Macrophage‐selective uptake of DNDA. A) Quantitative MFI analysis of Cy5‐labeled DNDA uptake in CT26 and RAW264.7 cells. Data are shown as Mean ± SD (n = 3), and statistical significance was calculated via a two‐tailed unpaired t‐test, *** p < 0.001. B) The cellular uptake level of Cy5‐labeled DNDA in CT26 cocultured with RAW264.7 in indicated tumor cell/macrophage (T/M) ratios. Data are shown as Mean ± SD (n = 3), and statistical significance was calculated via two‐way ANOVA with Sidak's post hoc test, *** p < 0.001. C) Percentage of Cy5+ tumor cells (gated on L/D− Cy5+ GFP+ cells) and Cy5+ macrophages (gated on L/D− Cy5+ CD45+ CD11b+ F4/80+ cells) in DNDA‐Cy5+ cells after injected with Cy5‐labeled DNDA in MC38‐GFP tumor‐bearing mice. Data are shown as Mean ± SD (n = 5), and statistical significance was calculated via two‐tailed unpaired t‐test, *** p < 0.001. D) Representative flow cytometric plots of Cy5+ GFP+ tumor cells and Cy5+ macrophages in tumors. E,F) Quantitative Cy5 MFI analysis in tumor cells and macrophages at 12 h post intratumoral injection of Cy5‐labeled DNDA. Data are shown as the Mean ± SD (n = 5), and statistical significance was calculated via a two‐tailed unpaired t‐test, *** p < 0.001.
