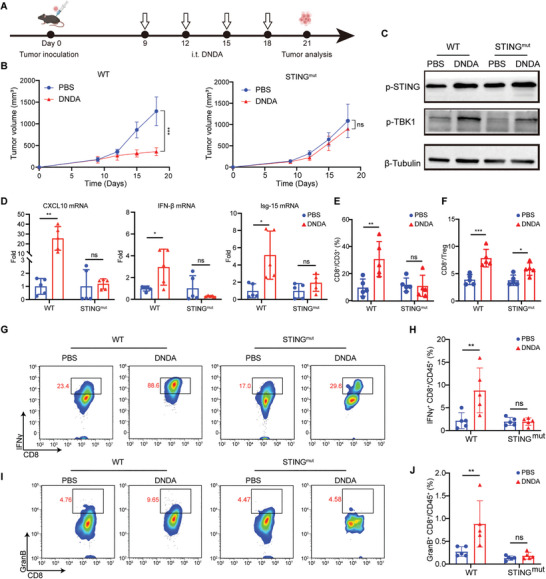
Figure 4.

cGAS‐STING activation by DNDA in tumor‐bearing mice. A) Treatment schedule of DNDA in MC38 tumor‐bearing C57BL/6 WT and STINGmut mice. B) Tumor growth curve of MC38 tumors with indicated treatment in C57BL/6 WT mice and STINGmut mice. Data are shown as Mean ± SD (n = 5), statistical significance was calculated via two‐way ANOVA with Tukey's post hoc test, *** p < 0.001, ns means no significance. C) Immunoblotting assay of STING and TBK‐1 phosphorylation level and D) Real‐Time PCR analysis of mRNA level of CXCL10, IFN‐β, and Isg‐15 in tumor tissues from WT or STINGmut mice with indicated treatment. Data are shown as Mean ± SD (n = 5), statistical significance was calculated via two‐way ANOVA with Sidak's post hoc test, * p < 0.05, ** p < 0.01, ns means no significance. Quantitative analysis of E) tumor‐infiltrated CD8+ T cells (gated on L/D− CD3+ CD8+ cells) and F) the ratio between tumor‐infiltrated CD8+ T cells (gated on L/D− CD3+ CD8+ cells) and regulatory T cells (gated on L/D− CD3+ CD4+ Foxp3+ cells). Data are shown as Mean ± SD (n = 5), statistical significance was calculated via two‐way ANOVA with Sidak's post hoc test, * p < 0.05, ** p < 0.01, *** p < 0.001, ns means no significance. Representative flow cytometric plots of G) IFNγ+ CD8+ T cells and I) GranB+ CD8+ T cells in tumors on day 21 post‐tumor inoculation. The frequency of H) IFNγ+ CD8+ T cells (gated on L/D− CD45+ CD3+ CD8+ IFNγ+ cells) and J) GranB+ CD8+ T cells (gated on L/D− CD45+ CD3+ CD8+ Granzyme B+ cells) in tumors analyzed on day 21 post tumor inoculation. Data are shown as the Mean ± SD (n = 5), statistical significance was calculated via two‐way ANOVA with Sidak's post hoc test, ** p < 0.01, ns means no significance.
