Figure 3.

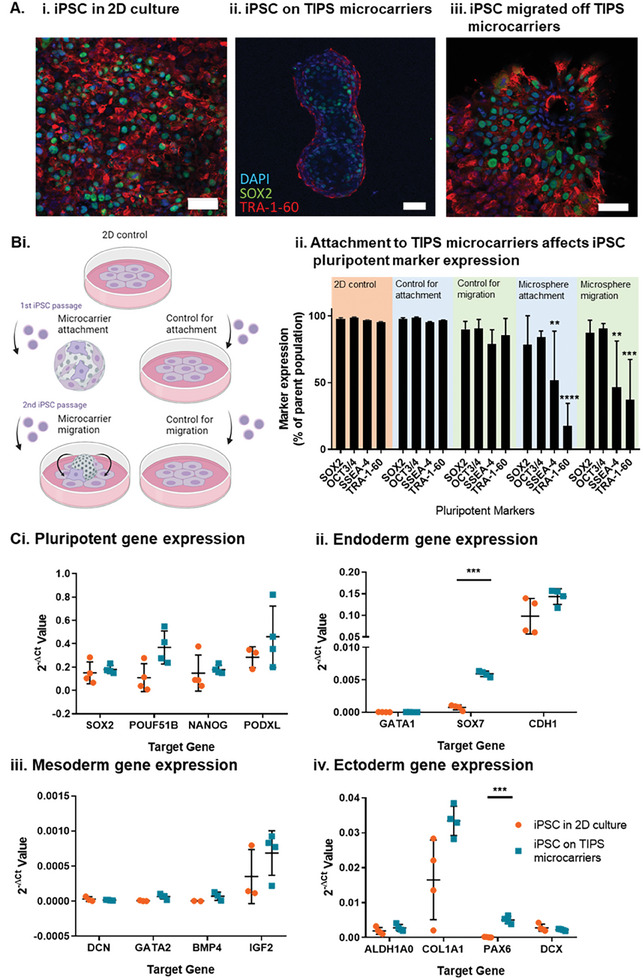
Characterization of iPSC pluripotent phenotype by A) confocal microscopy, B) flow cytometry and C) qRT‐PCR. Retention of iPSC pluripotency markers, SOX2 (green), TRA‐1‐60 (red) and DAPI (blue), in (Ai) 2D control tissue culture plastic conditions, (ii) attached to TIPS microcarriers for 24 hours and (iii) migrated for 72 hours, off TIPS microcarriers and onto 2D control conditions. B) Flow cytometric assessment of iPSC phenotype in different culture conditions and matched passaging controls. Attachment and migration controls were investigated, matching the passaging of cells and length of culture conditions, with re‐attachment onto 2D control conditions. Attachment samples consisted of iPSC passaged from 2D tissue culture conditions and seeded onto TIPS microcarriers or VTN‐N coated plates for 24 hours (control). Migration samples, consisted of iPSC passaged first from 2D tissue culture conditions and seeded on TIPS microcarriers or VTN‐N coated plates (control), and either migrated for 72 hours off TIPS microcarriers onto VTN‐N coated plates or (control) passaged a second time from the VTN‐N coated plate onto a fresh VTN‐N coated plates for 72 hours to match passage number and culture conditions. C) Trilineage differentiation marker expression in iPSC attached to TIPS microcarriers. Changes in (i) pluripotent, (ii) endoderm, (iii) mesoderm, and (iv) ectoderm gene expression in iPSC attached to TIPS microcarriers compared with iPSC grown on 2D control tissue culture surface. Gene expression was calculated relative to the expression of the house keeping gene glyceraldehyde‐3‐phosphate dehydrogenase (GAPDH). Scale bar represents 50 µm. Data are presented as mean ±SD. The significance of the data was calculated by (B) Two‐way ANOVA, Dunnett's post‐hoc correction and (C) unpaired t‐test with Holm‐Sidak's post hoc analysis. (n = 3‐4, **P ≤ 0.01, ***P ≤ 0.001 ****P ≤ 0.0001, statistics to matched 2D control).
