Figure 4.

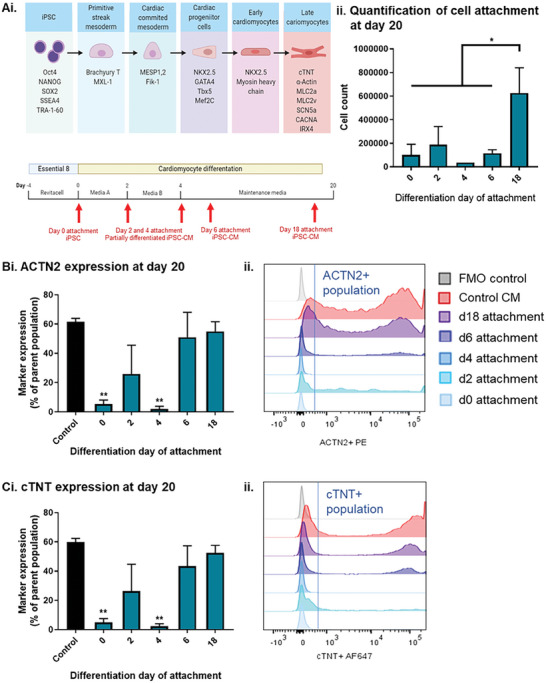
Assessing cardiac differentiation of iPSC on TIPS microcarriers. Ai) Schematic of CM differentiation strategy and corresponding cell phenotypes for attachment to TIPS microcarriers. Red arrows denote the time points at which the partly differentiated and differentiated CM were attached to the TIPS microcarriers. iPSC at day 0, partially differentiated iPSC‐CM, at day 2 and 4, and iPSC‐CM, at day 6 and 18 of differentiation were attached to TIPS microcarriers. After attachment, cells were terminally differentiated into cardiomyocytes up to day 20. (ii) Quantification of iPSC‐CM attached to TIPS microcarriers at day 20. Flow cytometric characterisation of the expression of cardiac markers B) ACTN2 and C) cTNT at day 20, in iPSC‐CM attached to TIPS microcarriers. The expression of the markers was (i) quantified and (ii) representative histograms of quantified samples plotted against tissue culture and FMO controls. Data are presented as mean ±SD. The significance of the data was calculated by One‐way ANOVA with Dunnett's post hoc analysis. (n = 4, *P ≤ 0.05 and **P ≤ 0.01, statistics to matched control CM).
