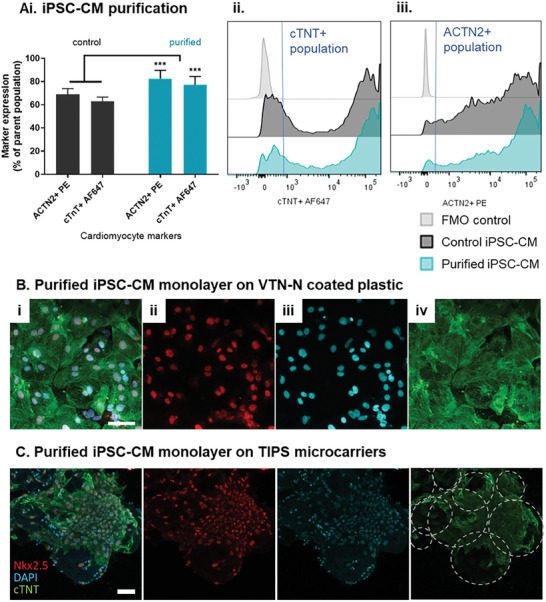
Figure 5.

Magnetic purification of iPSC‐CM. A) Flow cytometric characterisation of the expression of cardiac markers cTNT and ACTN2 in iPSC‐CM purified on day 18 of differentiation. After purification, iPSC‐CM were seeded on VTN‐N coated plastic dishes for 2D control and TIPS microcarriers for 7 days to produce monolayers. Confocal micrographs of purified iPSC‐CM monolayer on VTN‐N coated plastic dish B) and on TIPS microcarriers C) 7 days post‐seeding. Visualisation of (ii) NKx2.5 in red, (iii) DAPI in blue, (iv) cTNT in green and (i) composite images. Microcarriers outlined by dotted lines. Scale bar represents 50 µm. Data are presented as mean ±SD. The significance of the data was calculated by two‐way ANOVA with Sidak's post hoc analysis. (n = 4, ***P ≤ 0.001, statistics to matched control CM).
