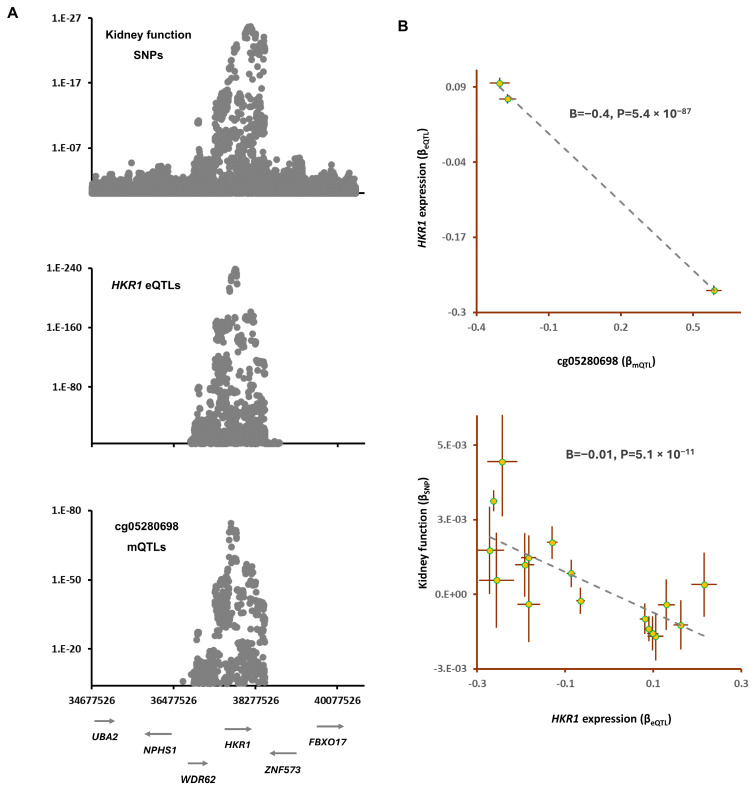
Figure 4.
The mechanism whereby cg05280698 exerts the impact of vitamin B12 supplementation on kidney function: (A) regional association plots for mQTLs of cg05280698, eQTLs of HKR1 and SNPs for kidney function overlap. The cg05280698 site is reported to become hypermethylated in people who take vitamin B12 supplementation (Table 3); and (B) MR analysis revealed that as the site becomes methylated, the expression of HKR1 decreases and that this leads to higher kidney function. Complete statistical details are available in Table 4. Points on MR plots represent SNPs; the x-value of an SNP is its effect size on the predictor, and the horizontal error bar indicates the standard error around the effect size. Similarly, the y-value of the SNP indicates its effect size on the outcome, and the vertical error bar indicates the standard error. The dashed line represents the line of best fit (a line with the intercept of 0 and the slope of B from the MR test).

