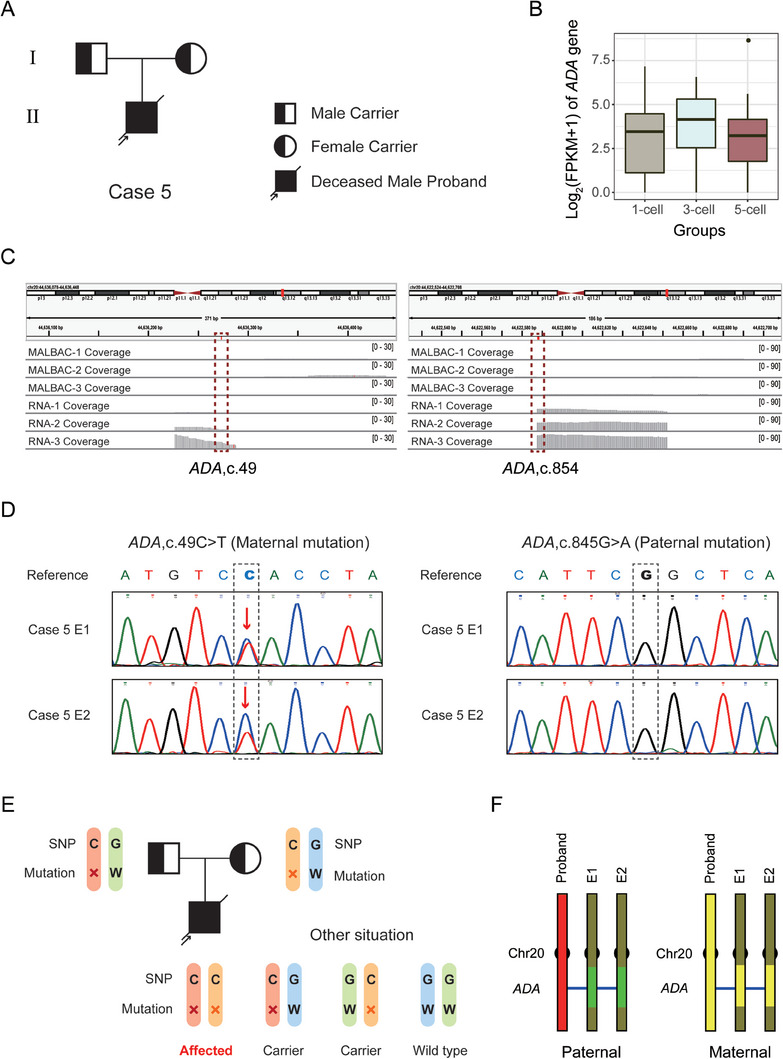
Figure 3.

RNA‐based mutation diagnosis for case 5 with autosomal recessive SCID. A) Pedigrees of the SCID family. The filled symbol represents the affected patient, and the half‐filled symbol represents the carrier of this disease. Circle and square indicate female and male, respectively. The arrow indicates the affected proband. Diagonal line represents a deceased individual. B) ADA gene expression levels were assessed in three TE groups. The abscissa indicates the 1‐cell, 3‐cell and 5‐cell groups and the ordinate represents the gene expression level united by log2 (FPKM+1). C) IGV plot shows the coverage of ADA in DNA and RNA sequencing data from TE cells. The mutation loci are indicated by red dotted boxes. D) The direct mutation detection results of 2 embryos in case 5 determined by Sanger sequencing following PCR based amplification of RNA. Dotted boxes show the mutation loci, and the red arrows indicate the mutations. E) SNP analysis schematic of this autosomal recessive case. The symbol “×” indicates the mutation and the letter “W” represents the wild‐type. The SNP base “C” is linked with the mutation allele and “G” is linked with the wild‐type allele. Embryos carrying C/C inherited parental mutations while those carrying G/G inherited parental wild‐type alleles. Embryos carrying C/G inherited only paternal or maternal mutations, which are also called carriers. F) The SNP analysis results of 2 embryos using WES and transcriptome data. SNP markers within 10 Mb upstream/downstream around the mutations were analyzed and illustrated.
