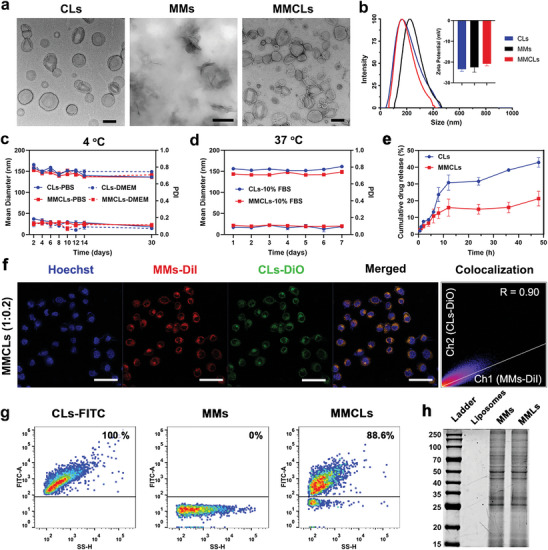
Figure 1.

Characterization of CLs, MMs, and MMCLs. a) Morphology of CLs, MMs, and MMCLs under TEM. b) DLS size distribution and zeta potentials of CLs, MMs, and MMCLs. c) Time‐dependent colloidal stability and dispersibility of CLs and MMCLs in PBS or DMEM at 4 °C for 30 days. d) Time‐dependent stability and dispersibility of CLs and MMCLs in 10% FBS at 37 °C for 7 days. e) Drug release profile of CLs and MMCLs in PBS buffer containing 0.5% Tween 80 under 37 °C for 48 h. f) Colocalization analysis of CLs and MMs after co‐extruded at phospholipid‐to‐membrane protein ratio of 1:0.2 and incubated with AML12 cells for 2 h. CLs were labeled by DiO and MMs were labeled by DiI, as visualized using a CLSM. Scale bar: 50 µm. g) The FITC‐positive ratio of CLs‐FITC, MMs, and MMCLs after co‐extruded at phospholipid‐to‐membrane protein ratio of 1:0.2 as detected by nano‐flow cytometry. h) The protein profile of liposomes, MMs, and MMLs as measured by SDS‐PAGE.
