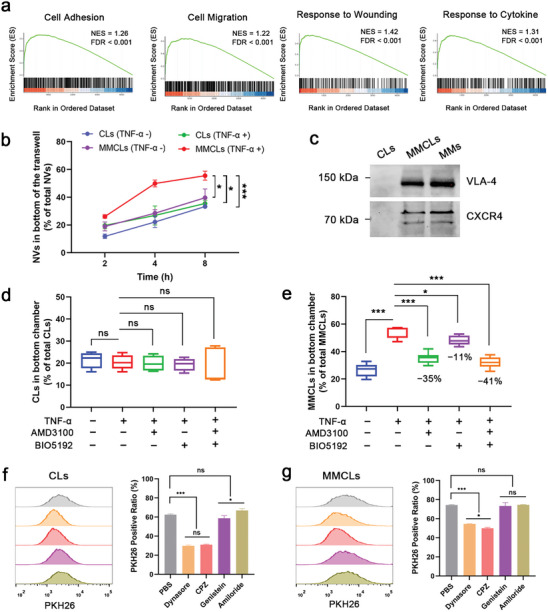
Figure 2.

Inflammatory chemotaxis and endocytosis pathway of CLs and MMCLs. a) Gene Set Enrichment Analysis (GSEA) of MMs. Enrichment plots for significant datasets enriched in GSEA analysis show the profile of the normalized ES and false discovery rate (FDR) ratio. b) The amount of NVs in the bottom chamber at 2, 4, and 8 h after the addition of PKH26‐labeled CLs or MMCLs (n = 3). c) CXCR4 and VLA‐4 expression of CLs, MMCLs, and MMs detected by western blot assay. Inhibition by AMD3100 and BIO5192 of the suppression of transendothelial migration capability of PKH26‐labeled d) CLs and e) MMCLs (n = 5). Flow cytometry analysis and quantification of mean fluorescence intensity of PKH26‐labeled f) CLs and g) MMCLs internalized by AML12 cells under different endocytosis inhibitors (n = 3). Data are presented as mean ± SD. The statistical significance was analyzed using one‐way ANOVA following Tukey's multiple comparisons test (*p < 0.05; **p < 0.01; ***p < 0.001, ns = no significance).
