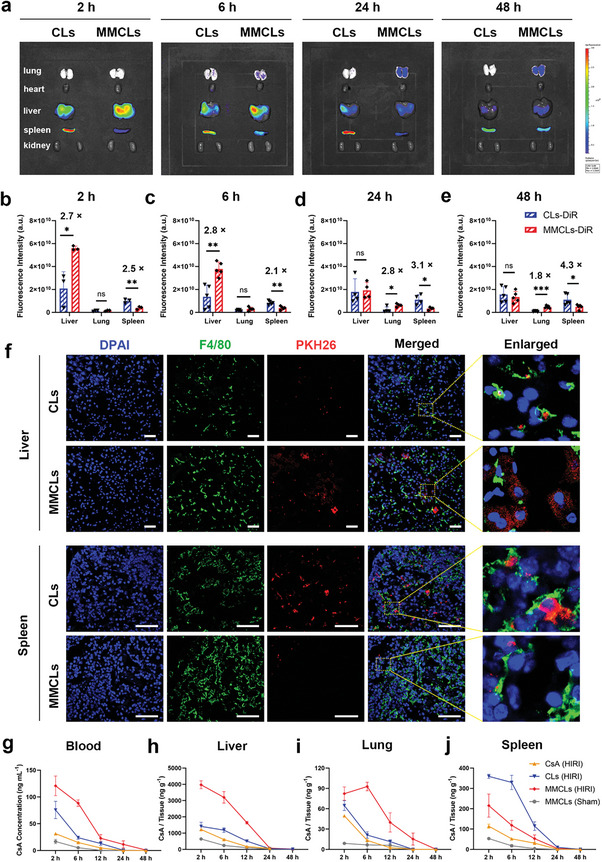
Figure 3.

Biodistribution and pharmacokinetic behavior of CsA, CLs, and MMCLs in a HIRI mice model through tail vein injection. a) Ex vivo tissue distribution of DiR‐labeled CLs and MMCLs in the main organs at different time points and the corresponding fluorescence signals of liver, lung, and spleen at b) 2 h, c) 6 h, d) 24 h, and e) 48 h after reperfusion (data are analyzed using two‐tailed t‐test, n = 5, *p < 0.05; **p < 0.01; ***p < 0.001; and ns, no significant difference). f) Immunofluorescence images of liver and spleen sections after intravenous administration of PKH26‐labeled CLs or MMCLs, with cell nuclei stained blue (DAPI) and macrophages stained green (F4/80). Scale bar: 50 µm. Quantification of the concentration of CsA in g) blood, h) liver, i) lung, and j) spleen after injection of free CsA, CLs, or MMCLs (at a CsA dose of 0.1 mg kg−1) into HIRI mice or sham‐operated mice (n = 3). The samples were homogenized and subjected to quantification of CsA concentration through LC‐MS analysis.
