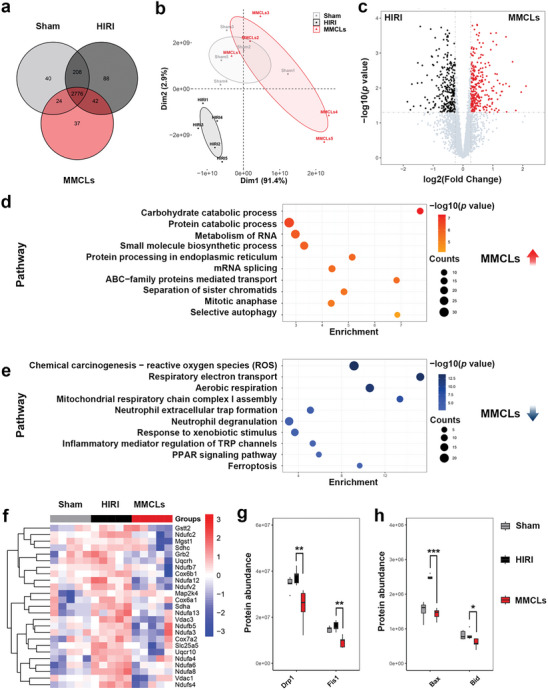
Figure 6.

Protein profile analysis of liver samples from the Sham group, HIRI group, and MMCLs treatment group. a) Venn diagram showing the overlap of high‐quality proteins. b) Principal components analysis of the enriched proteins. c) Volcano diagram showing the differently expressed proteins between the HIRI and the MMCLs treatment group, fold change > 1.2 or < 0.8, p < 0.05. Functional enrichment analysis of the differently expressed proteins d) upregulated or e) downregulated in the MMCLs treatment group compared to the HIRI group. f) Heatmap generated by clustering of the differentially expressed proteins in the three groups. Red: up‐regulation; blue: downregulation. The expression quantity of the corresponding proteins enriched in positive regulation of g) mitochondrial fission and h) cellular apoptosis. Data are analyzed using a two‐tailed t‐test, *p < 0.05; **p < 0.01; ***p < 0.001.
