
Figure 2.
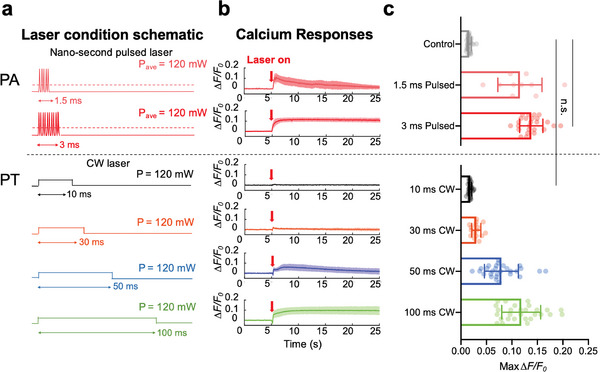
Comparison of neuron response upon PA and PT stimulation recorded by Ca2+ imaging. a) Schematic of different laser conditions used in PA/PT stimulation. Dark pink: pulsed laser with 5 pulses in 1.5 ms. Red: pulsed laser with 11 pulses in 3 ms. Black: CW laser with 10 ms duration. Orange: CW laser with 30 ms duration. Blue: CW laser with 50 ms duration. Green: CW laser with 100 ms duration. Average power of all laser conditions: 120 mW. b) Ca2+ traces of neurons under different laser conditions shown in a. Laser on at t = 5 s (Red arrows). Solid lines: averaged traces. Shaded areas: SD. c) Statistical analysis of maximum ΔF/F0 of neurons under PA and PT stimulation. n = 28, 10, 25, 28, 16, 28 for 1.5 ms pulsed, 3 ms pulsed, 10 ms CW, 30 ms CW, 50 ms CW, 100 ms CW, respectively. Control: no laser. n = 28 for control group, t‐test, **** p < 0.0001. n.s. no significance.