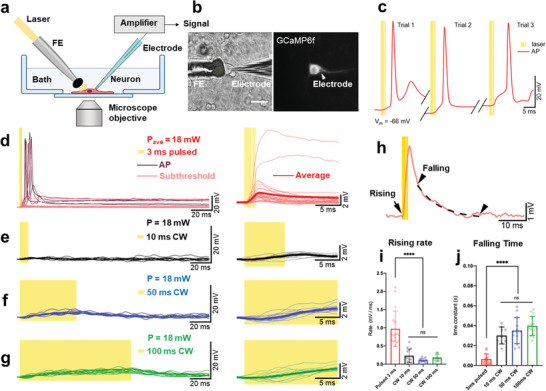
Figure 3.

PA‐triggered subthreshold depolarizations and action potentials (APs) are distinct from PT effects. a) Schematic of tapered FE stimulation and electrophysiological recording. b) Transmission and fluorescence images of simultaneous whole cell patch clamp and tapered FE stimulation on the same neuron. Left: transmission image. Right: GCaMP6f fluorescence image. Scale bar: 50 µm. c) Representative APs triggered by PA stimulation in three consecutive trials on one neuron. Each yellow line denotes a 3 ns laser pulse. d) Overlaying representative single trial recordings of membrane responses, including APs and subthreshold membrane depolarizations, induced by 3 ms pulsed laser (n = 41, from 6 cells). Dark red traces: APs. Pink traces: subthreshold depolarizations (n = 27, 4 cells). Yellow shaded area denotes pulsed laser on. Right panel: Same subthreshold depolarization traces at the early stage of depolarizations. Bold red line: average of all the subthreshold depolarizations. e–g) Overlaying representative single traces of membrane responses triggered by CW laser of 10, 50, and 100 ms duration (n = 17, from 3 cells). Yellow shaded area denotes laser on. Right panel: the same traces show the beginning of the depolarizations. Bold lines: average of the traces in each condition. All traces in (d–g) were normalized to the same baseline at 2 ms before laser delivery. h) An example trace from panel d indicating the selected time points for measurements in (i) and (j). The black arrow denoted the selected time point when the rising rate in (i) was measured. Two arrow heads point out the start and end of the selected period for calculating the time constant in the decay phase in (j). Dashed line: single exponential fit of the selected curve between the arrow heads. i) Statistical summary of the rising rate of the subthreshold depolarizations at the very beginning in respond to FE stimulation. ANOVA test. **** p < 0.0001. j) Statistical comparison of the time constant of the decay phase in PA and PT‐triggered subthreshold depolarizations. ANOVA test. **** p < 0.0001. APs in (d) were excluded from statistical analysis in (i) and (j) for comparison of only subthreshold events.
