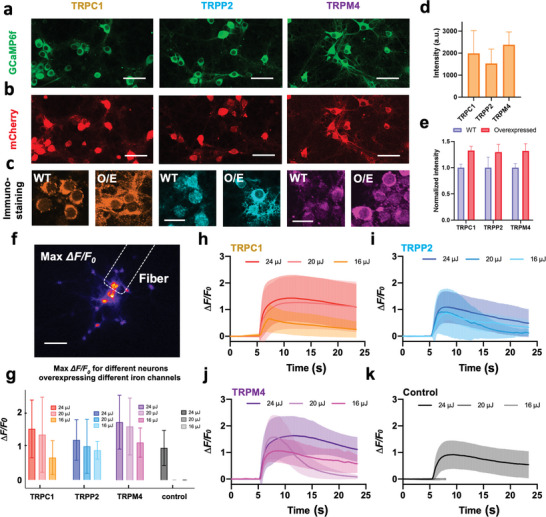
Figure 5.

Response of neurons to PA stimulation after overexpression of mechanical sensitive ion channels. a) Neurons expressing GCaMP6f as a calcium indicator. b) Co‐expressing of mCherry with the TRPC1/TRPP2/TRPM4 ion channels. Scale bars: 50 µm. c) Immunostaining of ion channels in the wild type (WT) group and overexpression (O/E) groups. Scale bars: 20 µm. d) Statistics of the mCherry signal intensity. n = 3 for each group. e) Statistics of the immunostaining signal intensity. n = 3 for each group. f) Representative max ΔF/F0 contrast imaging of tapered FE‐based PA stimulation. Dashed line: location of the tapered FE. Scale bar: 100 µm. g) Analysis of the calcium responses of neurons overexpressing ion channels upon FE stimulation with varied laser pulse energy. Error bars: SD. h–k) Calcium traces of neurons overexpressing TRPC1 (n = 87) / TRPP2 (n = 28) / TRPM4 channels (n = 26) and control group (n = 55, recording was ended early due to no response observed) upon FE stimulation with varied laser pulse energy. Shaded areas: SD. Control: wild type.
