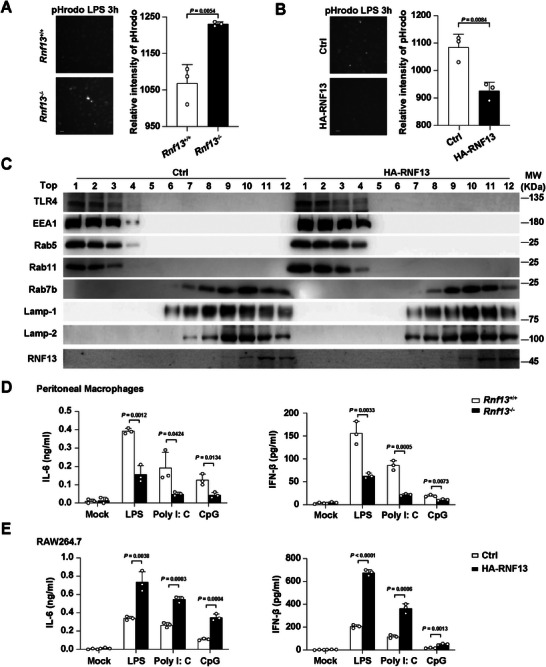
Figure 1.

RNF13 suppresses endo‐lysosome acidification and promotes TLR‐triggered pro‐inflammatory cytokines production in macrophages. A) Images shot by HCS from pHrodo assay of endo‐lysosome acidification in Rnf13 +/+ or Rnf13 −/− RAW264.7 cells along with LPS stimulation for 3 h. The relative intensity of pHrodo represents the acidity, which were from three independent experiments. (Scale Bar, 5 µm) B) Images shot by HCS from pHrodo assay of endo‐lysosome acidification in control (Ctrl) or RNF13 overexpressing (HA‐RNF13) RAW264.7 cells along with LPS stimulation for 3 h. The relative intensity of pHrodo represents the acidity, which were from three independent experiments. (Scale Bar, 5 µm.) C) Western blot assay of subcellular fraction in control (Ctrl) or RNF13 overexpressing (HA‐RNF13) RAW264.7 cells treated with LPS for 3 h. Top1 to Top12 orderly contains the supernatant of different subcellular fractions, respectively, referring to Subcellular fraction assay. D) ELISA assay of IL‐6 in the supernatants of primary peritoneal macrophages from Rnf13 +/+ or Rnf13 −/− mice treated with LPS (100 ng mL−1), Poly I: C (10 µg mL−1) or CpG (2 µm) for 6 h, respectively. E) ELISA assay of IFN‐β in the supernatants of control (Ctrl) or RNF13 overexpressing (HA‐RNF13) RAW264.7 cells treated with LPS (100 ng mL−1), Poly I: C (10 µg mL−1) or CpG (2 µM) for 6 h, respectively. Data are representative of three independent experiments (A–C) or shown as mean ± SD of n = 3 biological replicates (A, B, D, E), two‐tailed unpaired Student's t‐test (A, B, D, E).
