
Figure 3.
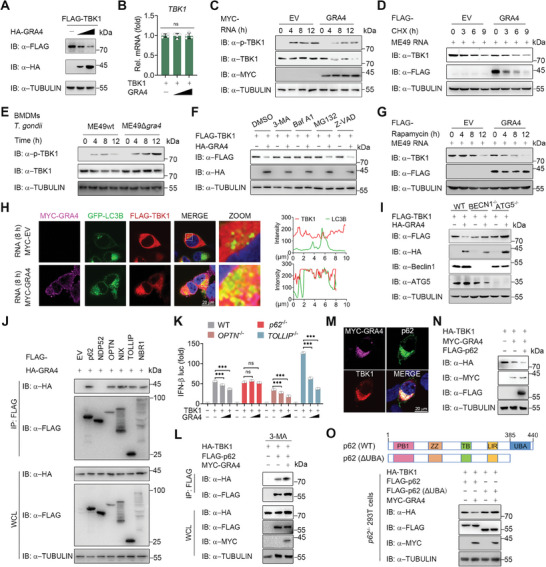
GRA4 induces the autophagic degradation of TBK1 in a Sequestosome 1 (SQSTM1)/p62 dependent manner. A,B) Immunoblotting and qPCR analysis of TBK1 protein and mRNA level extracts of 293T cells transfected with FLAG‐TBK1, HA‐EV or increasing amounts of HA‐GRA4. C) Immunoblotting analysis of total and phosphorylated TBK1 in 293T cells transfected with MYC‐EV or ‐GRA4, followed by treatment with ME49 RNA at indicated time points. D) Immunoblotting analysis of total TBK1 in 293T cells transfected with FLAG‐EV or ‐GRA4, pre‐stimulated by ME49 RNA for 8 h, and then treated with cycloheximide (CHX) (100 µg/mL) for indicated time points. E) Immunoblotting analysis of total and phosphorylated TBK1 in BMDMs followed by ME49wt or ME49∆gra4 (MOI = 5) infection at indicated time points. F) Immunoblotting analysis of 293 T cells transfected with FLAG‐TBK1, together with HA‐EV or ‐GRA4, followed by treatments of 3‐MA (10 mm), bafilomycin A1 (Baf A1) (0.2 µm), MG132 (10 µm), and Z‐VAD (50 µm) for 6 h respectively. G) Immunoblotting analysis of total TBK1 in 293T cells transfected with FLAG‐EV or ‐GRA4, pre‐stimulated by ME49 RNA for 8 h and then treated with rapamycin (250 nM) for indicated time points. H) Representative confocal images of 293T cells overexpressing FLAG‐TBK1, GFP‐LC3B, together with MYC‐EV or GRA4. Cells are treated with parasitic RNA for 8 h. Nuclei are stained with DAPI. The intensity analysis is next to it. Scale bars, 20 µm. I) Immunoblotting analysis of WT, BECN1 KO, and ATG5 KO 293T cells transfected with FLAG‐TBK1, together with HA‐EV or HA‐GRA4. J) Immunoblotting analysis of 293T cells transfected with FLAG‐EV, ‐p62, ‐NDP52, ‐OPTN, ‐NIX, ‐TOLLIP, or ‐NBR1, and HA‐GRA4, followed by IP with anti‐FLAG beads. K) Luciferase activity in WT, p62 KO, OPTN KO or TOLLIP KO 293T cells transfected with a luciferase reporter for IFN‐β‐luc, FLAG‐TBK1, HA‐EV or increasing amounts of HA‐GRA4, is shown. L) Immunoblotting analysis of 293T cells transfected with HA‐TBK1, FLAG‐p62 and MYC‐ GRA4, followed by treatment with 3‐MA (10 mm), and then IP with anti‐FLAG beads. M) Representative confocal images of 293T cells overexpressing FLAG‐TBK1, HA‐p62, together with MYC‐GRA4. Scale bars, 20 µm. N) Immunoblotting analysis of 293T cells transfected with various combinations of plasmid encoding HA‐TBK1, MYC‐GRA4, and Flag‐p62, is shown. O) Immunoblotting analysis of p62 KO 293T cells transfected with HA‐TBK1, FLAG‐p62 or ‐p62ΔUBA, and MYC‐GRA4 or ‐EV. luc: luciferase, IP: immunoprecipitation, WCL, whole cell lysis, IB: immunoblotting. Data with error bars are represented as means ± SD. Each panel is a representative experiment of at least three independent biological replicates. *** p < 0.001 and ns (not significant) as determined by unpaired Student's t test.