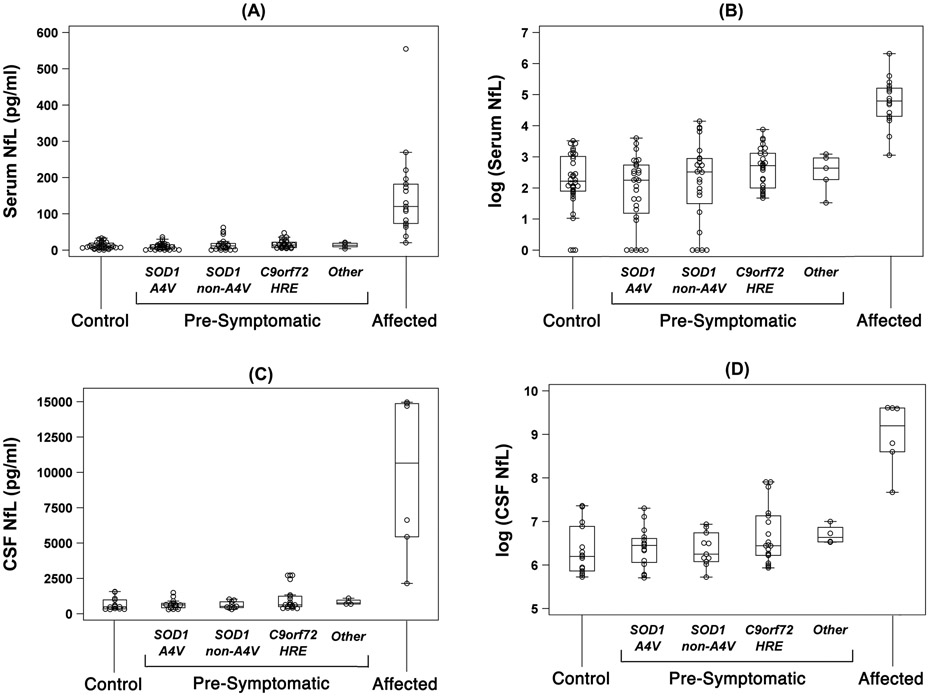
Figure 1.
Baseline levels of NfL in serum and CSF: (a) serum NfL (pg/ml); (b) log-transformed serum NfL; (c) CSF NfL (pg/ml); and (d) log-transformed CSF NfL. Boxes show median, and 25th and 75th percentiles; whiskers extend to a maximum of 1.5 x interquartile range (IQR), or to the most extreme value if it is less than 1.5 x IQR from the 25th or 75th percentile.

