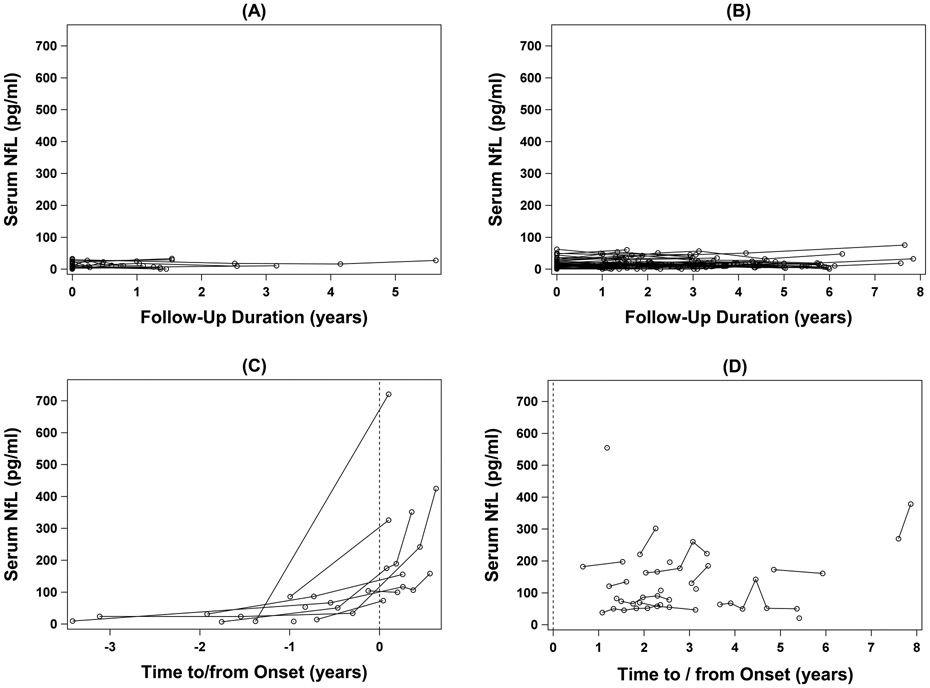
Figure 2.
Longitudinal changes in serum NfL concentration (pg/ml): (a) controls; (b) at-risk individuals who remain pre-symptomatic throughout follow-up; (c) phenoconverters; and (d) ALS patients. The x-axis in (a) and (b) shows years since baseline. The x-axis in (c) and (d) shows years to or since the onset of symptoms or signs, which is marked by the vertical dashed line at year=0.

