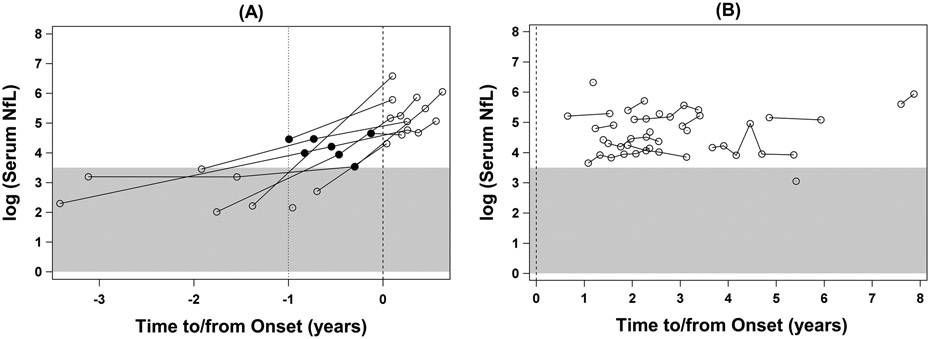
Figure 3.
Longitudinal changes in serum NfL concentration, natural log-transformed: (a) phenoconverters; and (b) ALS patients. The x-axis shows years to or since the onset of symptoms or signs, which is marked by the vertical dashed line at year=0. The gray area covers the range of serum NfL values observed in the control group. The closed circles mark the elevated levels of NfL (i.e. above the highest value seen in controls) that were measured in serum collected before the onset of symptoms or signs.

