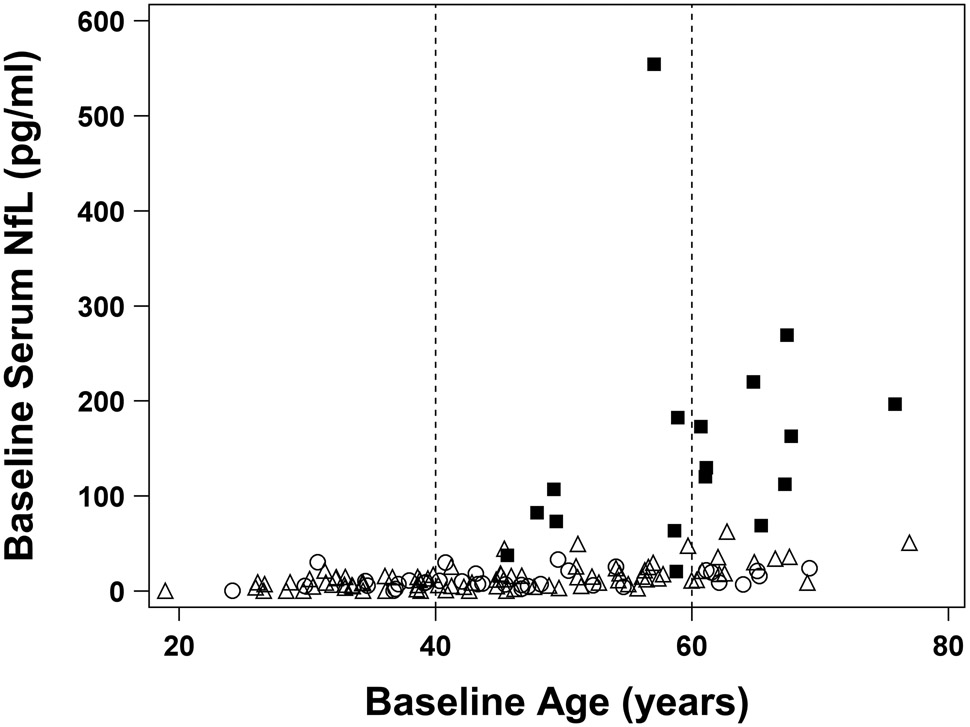
Figure 4.
Scatterplot of baseline serum NfL levels vs. baseline age shows that, although NfL levels are slightly higher among older individuals in the control (open circles) and at-risk groups (open triangles), the magnitude of this increase is negligible in comparison to the levels of NfL observed among ALS (closed squares) patients (i.e. older age does not explain the increase in serum NfL among ALS patients). Open circles represent controls; open triangles represent at-risk individuals who remain pre-symptomatic throughout follow-up; and filled squares represent ALS patients. Vertical dashed lines demarcate age groups (< 40, 40-60 and > 60 years of age).

