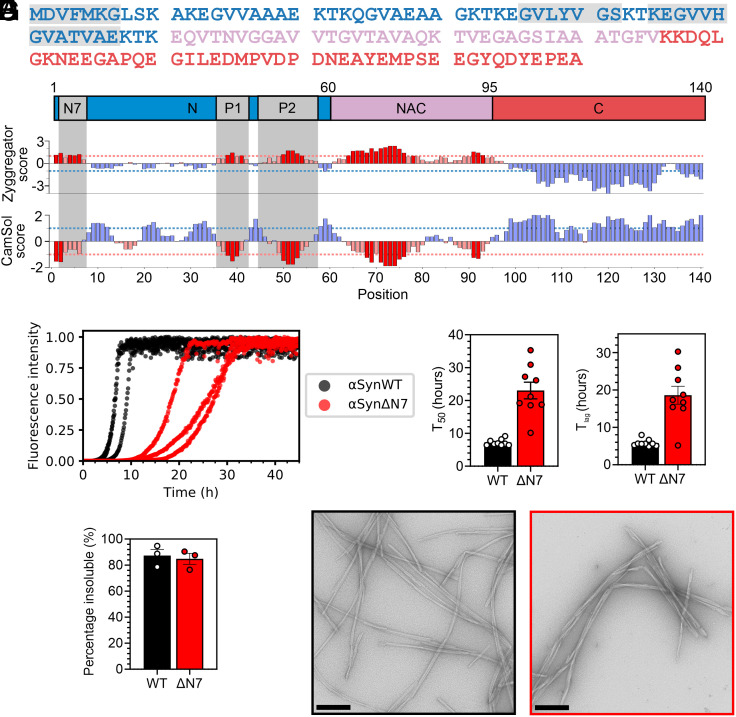
Fig. 1.
Deletion of residues 2 to 7 of αSyn slows amyloid formation in vitro. (A) Amino acid sequence of αSynWT. Blue = N-terminal region; pink = NAC; and red = C-terminal region. (B) Zyggregator (24) and CamSol (25) profiles for αSyn. Red bars indicate predicted aggregation-prone and low-solubility regions, respectively. For A and B, the N7 (2DVFMKG7), P1 (36GVLYVGS42), and P2 (45KEGVVHGVATVAE57) regions are in gray. (C) Fibril formation kinetics of αSynWT (black) and αSynΔN7 (red). Data are normalized to maximum signal of each curve. (D) T50 and (E) Tlag values for nine replicates. (F) Quantification of the insoluble fraction at the end point of ThT assays. (G) Negative-stain electron micrographs of the ThT end points for αSynWT (black) and αSynΔN7 (red). (Scale bar, 250 nm.)

