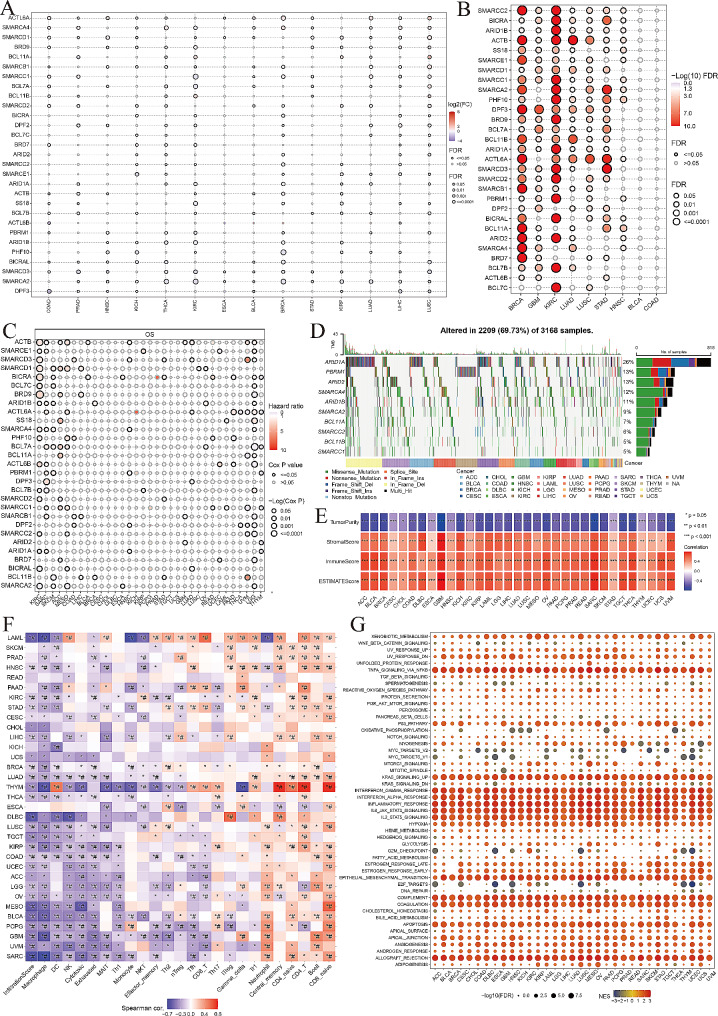
Fig. 1.
Gene expression, genetic alteration, immune infiltration, effect on the signaling pathway, and responsiveness to drugs of SWI/SNF complex-related genes (SCRGs). (A) Differential expression analysis of SCRGs in 14 tumor types that meet the inclusion criteria with more than 10 available normal tissues adjacent to the tumors, represented by log2(FC) and false discovery rate (FDR) values. The color scale represents log2(FC) values, with red indicating upregulation (log2 (FC) > 0) and blue indicating downregulation (log2(FC) < 0). (B) Differential expression analysis of SCRGs in different tumor subtypes. The redder the color, the higher the FDR value. (C) Prognostic survival analysis of SCRGs for 33 tumor types. The Hazard Ratio (HR) value is indicated by the color, with a higher HR value in redder colors. (D) The waterfall plot shows the mutation distribution and types of the top 10 mutated genes in SCRGs. (E) Spearman correlation analysis of the ESTIMATE score and single-sample gene set enrichment analysis (ssGSEA) score: positive correlation in red, negative correlation in blue. *P < 0.05, **P < 0.01, ***P < 0.001. (F) Spearman correlation analysis of gene set variation analysis (GSVA) score and immune cell infiltration. *P < 0.05; #FDR < 0.05. (G) Gene set enrichment analysis (GSEA) of SCRGs in pan-cancer. The size of the circles represents the FDR value for each enrichment cancer pathway, and the color represents the normalized enrichment score (NES) for each enrichment cancer pathway

