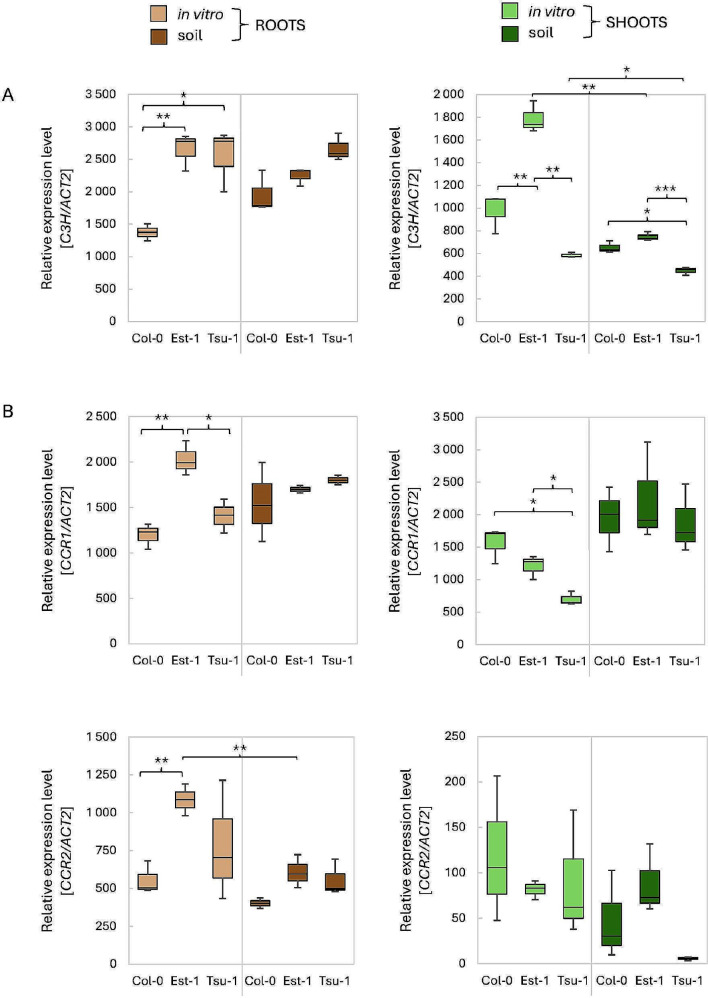
Fig. 10.
Relative expression levels of the C3’H (A) and CCRs (B) genes measured by qPCR. As a reference, the ACT2 (At3g18780) gene was used. The expression levels were quantified in three Arabidopsis genetic backgrounds (Col-0, Est-1, Tsu-1) grown in in vitro liquid culture and in soil, in two types of tissues (leaves and roots). Means and error bars for absolute deviations are shown. Values: p < 0.001 (***), p < 0.01 (**) and p < 0.05 (*)

