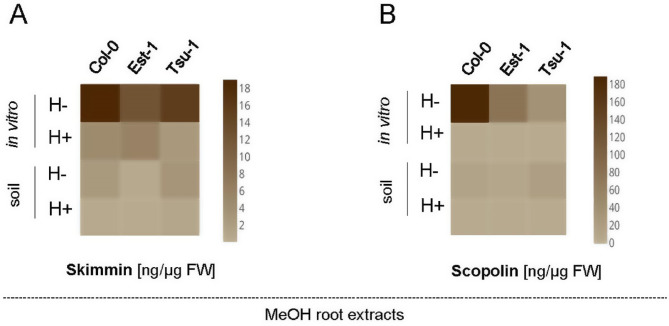
Fig. 5.
Heat maps showing the quantification of skimmin (A) and scopolin (B) in the Arabidopsis root extracts before (H-) and after (H+) enzymatic hydrolysis. Methanol extracts were prepared from Col-0, Est-1 and Tsu-1 Arabidopsis accessions grown in in vitro liquid culture and in soil, quantified by UHPLC. The color scale represents the compound concentration given in ng/µg FW (fresh weight); dark brown indicates high concentration and light brown denotes low concentration

