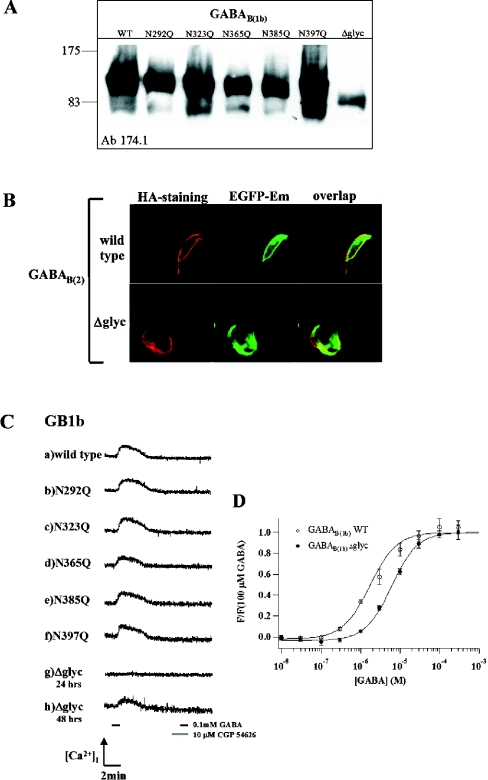
Figure 3. Functional analysis of GABAB(1b) glycosylation mutants.
(A) Western blot. WT, wild-type GABAB(1b); lanes 2–6, single-point mutants; Δglyc, GABAB(1b)Δglyc, with all glycosylation sites mutated. No molecular mass shifts are observed between single-point glycosylation mutants; molecular mass was estimated to be approx. 130–135 kDa. The calculated molecular mass of GABAB(1b)Δglyc plus EGFP is 122.5 kDa. (B) Surface expression of glycosylation-deficient GABAB(1b) receptor. Staining for the haemagglutinin tag (first row, HA-staining), EGFP emission (second row, EGFP-Em) and overlap of the two (third row, overlap). (C) Fluorimetric analysis. HEK-293 cells, electrophorated with the cDNAs of GABAB(2), chimaeric GαqzIC, and either GABAB(1b) wild-type (a) or mutants (b–h) were perfused with 0.1 mM GABA for 60 s. The generated response could be completely antagonized using 10 μM CGP54626A (grey segment on the timescale), since no response was measured by subsequent application of GABA (black segment on the right side of timescale, 60 s). Lanes (a–g) display changes in fluorescence in response to GABA application 24 h post-transfection. Lanes (g) and (h) correspond to the GABAB(1b)Δglyc form, lane (g) 24 h after transfection, lane (h) 48 h after transfection. (D) Agonist concentration–response curves of wild-type and glycosylation-deficient GABAB(1b) receptors. HEK-293 cells were measured in FLIPR [12], 48 h after transfection of each variant together with GABAB(2) and chimaeric GαqzIC. Data points show average fluorescence values of 4 (WT) or 8 (Δglyc) wells ±S.E.M., normalized to the average response to 0.1 mM GABA. Hill equation fits gave EC50 values of 2.4 (1.7, 3.4) for WT and 6.4 μM (5.3, 7.8) for the Δglyc mutant (mean, 95% confidence interval).

