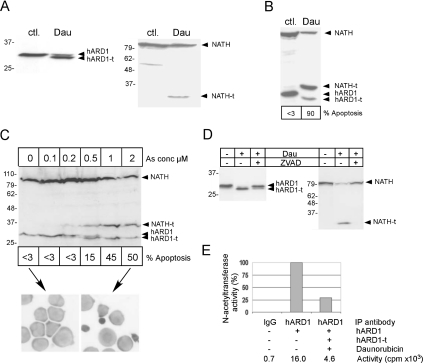
Figure 8. Cleavage of NATH and hARD1 in apoptosis.
(A) HeLa cells untreated (ctl.) or treated for 20 h with 10 μM daunorubicin (Dau). Shown in (A–D) are NATH, NATH-t, hARD1 and hARD1-t. (B) NB4 cells untreated (ctl.) or treated for 24 h with 200 nM Dau. % Apoptosis is the percentage of cells displaying apoptotic features as assessed by light microscopy. (C) NB4 cells untreated (0) or treated for 24 h with increasing concentrations of As2O3 as indicated. Bands representing hARD1-t and NATH-t are detected from 0.5 μM As2O3. Pictures display NB4 cells (100×) untreated, <3% apoptosis (left) or treated with 2 μM As0, approx. 50% apoptosis (right). (D) NB4 cells treated for 20 h with 200 nM Dau and for 10 h with 20 μM Z-VAD-FMK as indicated. (E) NATH–hARD1 complexes were immunoprecipitated from HeLa cells using limiting amounts of anti-hARD1 or rabbit IgG as a negative control. Apoptosis was induced by 10 μM daunorubicin for 20 h. The immunoprecipitates were incubated with corticotropin peptide amino acids 1–24 and [3H]acetyl-CoA, and the acetyl incorporation in corticotropin was determined by scintillation counting (c.p.m.). Percentage activity was adjusted according to the presence of hARD1/hARD1-t in the precipitates detected by Western blotting followed by densitometry. Five independent experiments were performed.

