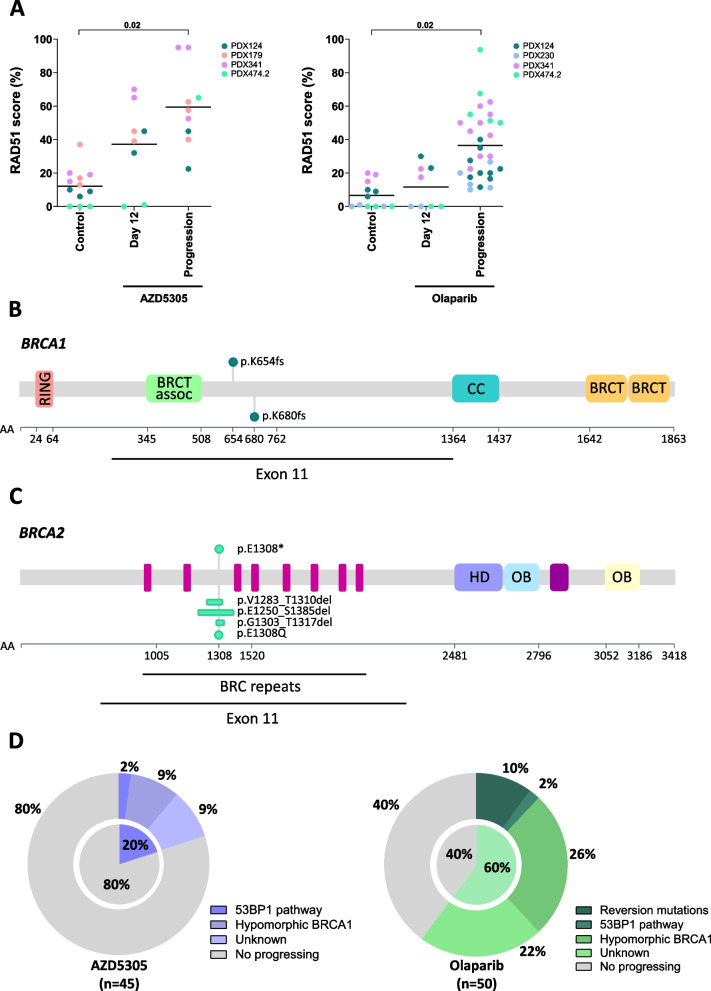
Fig. 3.
Mechanisms of resistance to AZD5305 and olaparib in PDXs. A Quantification by IF of the RAD51 score (%) in tumors that progressed under treatment with either PARPi, compared to tumors treated in the response phase (day 12) and untreated controls. p values are shown. Location of pathogenic (up) and reversion (down) mutations on the domain structure of B BRCA1 and C BRCA2. Each dot represents a patient. D Fraction of resistance mechanisms detected in individual tumors that had progressed to AZD5305 and olaparib in purple and green, respectively

